")
Back to Journals » Journal of Inflammation Research » Volume 17
The Baseline Pan-Immune‑Inflammation Value (PIV) and PILE in Predicting Clinical Outcomes and Therapeutic Response for Primary Central Nervous System Lymphoma
Authors Duan L, Guo W, Yin S, Yang S, Liu J, Duan Y, Dong G, Li W , Chen F
Received 6 May 2024
Accepted for publication 30 July 2024
Published 13 August 2024 Volume 2024:17 Pages 5347—5363
DOI https://doi.org/10.2147/JIR.S468537
Checked for plagiarism Yes
Review by Single anonymous peer review
Peer reviewer comments 2
Editor who approved publication: Dr Tara Strutt
Ling Duan,1 Wenhui Guo,1 Shuo Yin,1 Shoubo Yang,1 Jie Liu,2 Yunyun Duan,3 Gehong Dong,4 Wenbin Li,1 Feng Chen1
1Department of Neuro-Oncology, Cancer Center, Beijing Tiantan Hospital, Capital Medical University, Beijing, 100070, People’s Republic of China; 2Department of Clinical Diagnosis, Laboratory of Beijing Tiantan Hospital, Capital Medical University, Beijing, 100070, People’s Republic of China; 3Department of Radiology, Beijing Tiantan Hospital, Capital Medical University, Beijing, 100070, People’s Republic of China; 4Department of Pathology, Beijing Tiantan Hospital, Capital Medical University, Beijing, 100070, People’s Republic of China
Correspondence: Wenbin Li; Feng Chen, Department of Neuro-Oncology, Cancer Center, Beijing Tiantan Hospital, Capital Medical University, No. 119 West Nansihuan Road, Beijing, 100070, People’s Republic of China, Tel +86-10-59975034, Email [email protected]; [email protected]
Purpose: To investigate the prognostic significance of pan-immune-inflammation value (PIV) and PILE score (based on PIV, lactate dehydrogenase (LDH), and Eastern Cooperative Oncology Group Performance Status (ECOG PS)) in patients with primary central nervous system lymphoma (PCNSL).
Patients and Methods: A total of 109 patients were enrolled. PIV was calculated as follows: (neutrophil count × platelet count × monocyte count)/lymphocyte count. The PILE score was incorporated based on PIV, LDH levels, and ECOG PS. The Kaplan–Meier curves and Cox hazards regression models were applied for survival analyses. The relationship between PIV, PILE, and therapeutic response was examined.
Results: Baseline high PIV was significantly associated with worse overall survival (OS) in univariate (HR 3.990, 95% CI 1.778– 8.954, p < 0.001) and multivariate (HR 3.047, 95% CI 1.175– 7.897, p = 0.022) analyses. High PIV was also associated with worse progression-free survival (PFS) in univariate (HR 2.121, 95% CI 1.075– 4.186, p = 0.030) but not significant in multivariate analyses. PIV outperformed other systemic inflammation parameters. The patients in the high PILE group (PILE score 2– 3) had worse OS (p = 0.008) and PFS (p < 0.001) compared to the low PILE group (PILE score 0– 1). PILE was independently associated with therapeutic response to initial treatment (OR 0.17, 95% CI 0.05– 0.46; p < 0.001).
Conclusion: High PIV and PILE were correlated with worse clinical outcomes in PCNSL patients, indicating that PIV and PILE might be a powerful predictor of prognosis and a potential predictive indicator for therapeutic response in PCNSL.
Keywords: primary central nervous system lymphoma, pan-immune inflammation value, PILE score, prognosis
Introduction
Primary central nervous system lymphoma (PCNSL), a rare and highly aggressive type of extranodal non-Hodgkin lymphoma, involves exclusively the brain, spinal cord, leptomeninges, and/or eyes. PCNSL represents only ~4% of all newly diagnosed intracranial neoplasms and 4–6% of all extranodal lymphomas in immunocompetent patients.1 The incidence of PCNSL is about 0.3–0.6 cases per 1000000 people annually in the United States and has increased over the past four decades, particularly in patients older than 60 years.2–4 More than 90% of PCNSLs belong to the diffuse large B-cell lymphoma (DLBCL), with a predominantly nongerminal center B-cell-like (non-GCB) immunophenotype;5 rare forms include T-cell lymphoma and Burkitt lymphoma. The initial standard high-dose methotrexate (HD-MTX) based chemotherapy produces a high objective response rate (ORR) of around 50–90%.6,7 Nevertheless, 15–25% of patients presented no response to the standard therapy, and 25–50% relapsed after the initial response, resulting in a poor overall outcome.8,9 The 5-year overall survival (OS) rate ranges from 22.3% to 35%.10–12 Without treatment, the disease progresses rapidly, the OS is only 1.5 months.4,13 Thus, identifying patients with inferior outcomes with standard therapy is urgently required in clinical practice. We previously established an innovative prognostic model based on histopathological images,14 and the current study focuses on exploring the predictive value of peripheral blood-related markers in PCNSL.
Recent studies highlighted the predictive value of easily measurable blood-based biomarkers that reflect systemic inflammation, such as the neutrophil-to-lymphocyte ratio (NLR),15 the monocyte-to-lymphocyte ratio (MLR),16 the platelet-to-lymphocyte ratio (PLR),17 and the systemic immune-inflammation index (SII)18 in solid tumors. Recently, a novel comprehensive marker that represents the pan-immune-inflammation value (PIV) has been proposed as a more reliable predictor of clinical outcomes in patients with advanced colorectal cancer.19 It incorporates all routinely assessed blood cell populations, including neutrophils, monocytes, lymphocytes, and platelets. It was strongly associated with progression-free survival (PFS) and OS in metastatic colorectal cancer patients under first-line chemotherapy.19 Ligorio et al reported that PIV is an independent predictor of OS in Human Epidermal growth factor Receptor 2 positive (HER2+) advanced breast cancer patients treated with first-line trastuzumab-pertuzumab-containing chemotherapy.20 In addition, it outperformed other previously inflammatory-related markers such as SII, NLR, PLR, monocyte, and platelet counts in predicting patient outcomes.19,21
Moreover, the Eastern Cooperative Oncology Group Performance Status (ECOG PS) and blood lactate dehydrogenase (LDH) are classical prognostic factors for PCNSL. Clinical and laboratory parameters that are considered candidate prognostic biomarkers can be concluded to develop a compound prognostic score. PILE is a novel three-parameter score based on the PIV value, ECOG PS, and LDH value. The PILE score was proven to be associated with PFS and OS in a study containing 120 patients treated with anti-PD-1 or anti-PD-L1 inhibitors for any cancer type.22,23
However, the role of PIV and PILE in patients with PCNSL remains unclear. Therefore, in this retrospective study, we aimed to explore the predictive values of PIV and PILE in patients with PCNSL receiving initial treatment, which has not been studied before.
Materials and Methods
Patient Selection
We retrospectively enrolled patients newly diagnosed with PCNSL of DLBCL type who were treated at Beijing Tiantan Hospital between January 2019 and March 2023. The inclusion criteria were as follows: (1) histologically diagnosed CNS-DLBCL; (2) no other concomitant tumors; (3) adequate clinical, laboratory, and follow-up data available. The exclusion criteria were as follows: (1) evidence of systemic DLBCL from computed tomography (CT) or positron emission tomography CT (PET CT) of the chest, abdomen, pelvis, and bone marrow aspiration; (2) HIV-positive status, history of immunosuppression or organ transplantation; (3) with uncontrolled active infections or other illnesses; (4) missing clinical or follow-up data; The flowchart summarizing the patient selection is shown in Supplementary Figure 1A. This study was approved by the Institutional Review Board of Beijing Tiantan Hospital (approval number: 2020–059 YW), and written informed consent was obtained from all patients. All procedures complied with the standards of the Declaration of Helsinki.
Data Collection
Baseline clinical characteristics, including age, sex, ECOG PS, Karnofsky Performance Status (KPS), level of LDH, Hans, Biopsy type, deep lesions involvement, tumor size, number of lesions, the Memorial Sloan-Kettering Cancer Center (MSKCC) prognostic score,24 the process of treatment and response were collected. Initial treatment responses were assessed and categorized as either complete response (CR), partial response (PR), stable disease (SD), or progressive disease (PD), following the International Primary CNS Lymphoma Collaborative Group criteria.25 Patients in CR or PR were regarded as Responders, while those in SD or PD were categorized as Non-Responders. Patients who had progressed during the initial treatment were regarded as Primary Resistance. OS was defined from the date of diagnosis to death from any cause or the last follow-up. PFS was defined as the time from diagnosis to disease progression or all-cause death.
Baseline Systemic Inflammation Parameters
Baseline laboratory parameters were obtained before initial treatment, including absolute neutrophil count, absolute monocyte count, absolute platelet count, and absolute lymphocyte count. The Systemic Inflammation Parameters were calculated as follows: NLR = neutrophil count (109/L)/lymphocyte count (109/L), MLR = monocyte count (109/L)/lymphocyte count (109/L), PLR = platelet count (109/L)/lymphocyte count (109/L), SII = [platelet count (109/L) × neutrophil count (109/L)]/lymphocyte count (109/L), PIV = [neutrophil count (109/L) × monocyte count (109/L)× platelet count (109/L)]/lymphocyte count (109/L).19 The PILE score was generated based on PIV, LDH, and ECOG PS, which was calculated with the sum of individual values (for PIV < median = 0, ≥ median = 1; for LDH ≤ upper limit of normal (ULN) = 0, > ULN = 1; for ECOG PS < 2 = 0, ≥ 2 = 1).22,23 Patients were divided into low-risk (0–1) and high-risk (2–3) for PILE scores.
Statistical Analysis
Descriptive statistics were presented as the median, interquartile range (IQR; 25th–75th percentile), standard errors for continuous variables, and frequency and percentages for categorical variables. Student’s t-test, Wilcoxon’s, and Kruskal–Wallis tests were used to compare continuous variables. The Shapiro–Wilk test was used to test the normality of data distributions. Pearson’s chi-squared and Fisher’s exact tests were performed to compare categorical variables. The optimal cut-off values for NLR, PLR, MLR, SII, and PIV were determined by maximally selected rank statistics, according to the function “surv_cutpoint” from the survminer R package.19,26 The maximally selected rank statistics method is employed to determine the optimal cut-off value for continuous variables in survival analysis. This method identifies the cut-off point that maximizes the separation between two groups for survival outcomes. It iteratively evaluates all possible cut-off points and selects the one that provides the highest test statistic value. Survival curves were generated by the Kaplan-Meier curve and compared using the Log rank test. Cox regression models were applied in univariate and multivariate analyses, and only statistically significant factors were included in the multivariate Cox analysis. Factors associated with treatment response were tested with univariate and multivariate logistic regression analyses. All the tests were two-sided, and p < 0.05 was considered statistically significant. All statistical analyses were performed using R software (version 4.3.1).
Results
Patient Characteristics
A total of 109 patients were included in the study. The clinicopathological characteristics of the entire cohort are listed in Table 1. The median age of the entire cohort was 64 (IQR, 54–68). At the time of diagnosis, 39.45% of patients were older than 65. There was a mild predominance of females (50.46%). The non-GCB subtype (72.48%) comprised more than half of the patients. A total of 9 (8.26%) patients underwent surgical resection or open biopsy, and 100 (91.74%) patients underwent stereotactic biopsy. Most patients (75.23%) had a small lesion, with 24.77% of patients’ lesions (n = 27) larger than 5 cm. Forty-four patients (40.37%) presented with a single lesion, and 81 patients (74.31%) had deep brain involvement (corpus callosum, basal ganglia, periventricular region, brainstem, and/or cerebellum). Eighty (73.39%) patients had an ECOG PS ≥ 2. Elevated serum LDH level was observed in 21 patients (24.14%). The risk was low, intermediate, and high in 11 (10.09%), 73 (66.97%), and 25 (22.94%) patients, according to the MSKCC score. All patients in our cohort received high-dose methotrexate-based chemotherapy, and the choice of treatment was mainly based on the patient’s physical condition, age, and contraindications. Of all patients, 16 received chemotherapy (CT) combined with radiotherapy (RT), 43 (39.45%) received BTK inhibitors (BTKi) therapy, and 34 (31.09%) received consolidation therapy. After the initial treatment, 63 patients (57.80%) achieved CR, 9 patients (8.26%) achieved PR, 4 patients (3.3%) experienced SD, and 33 patients (30.28%) had PD.
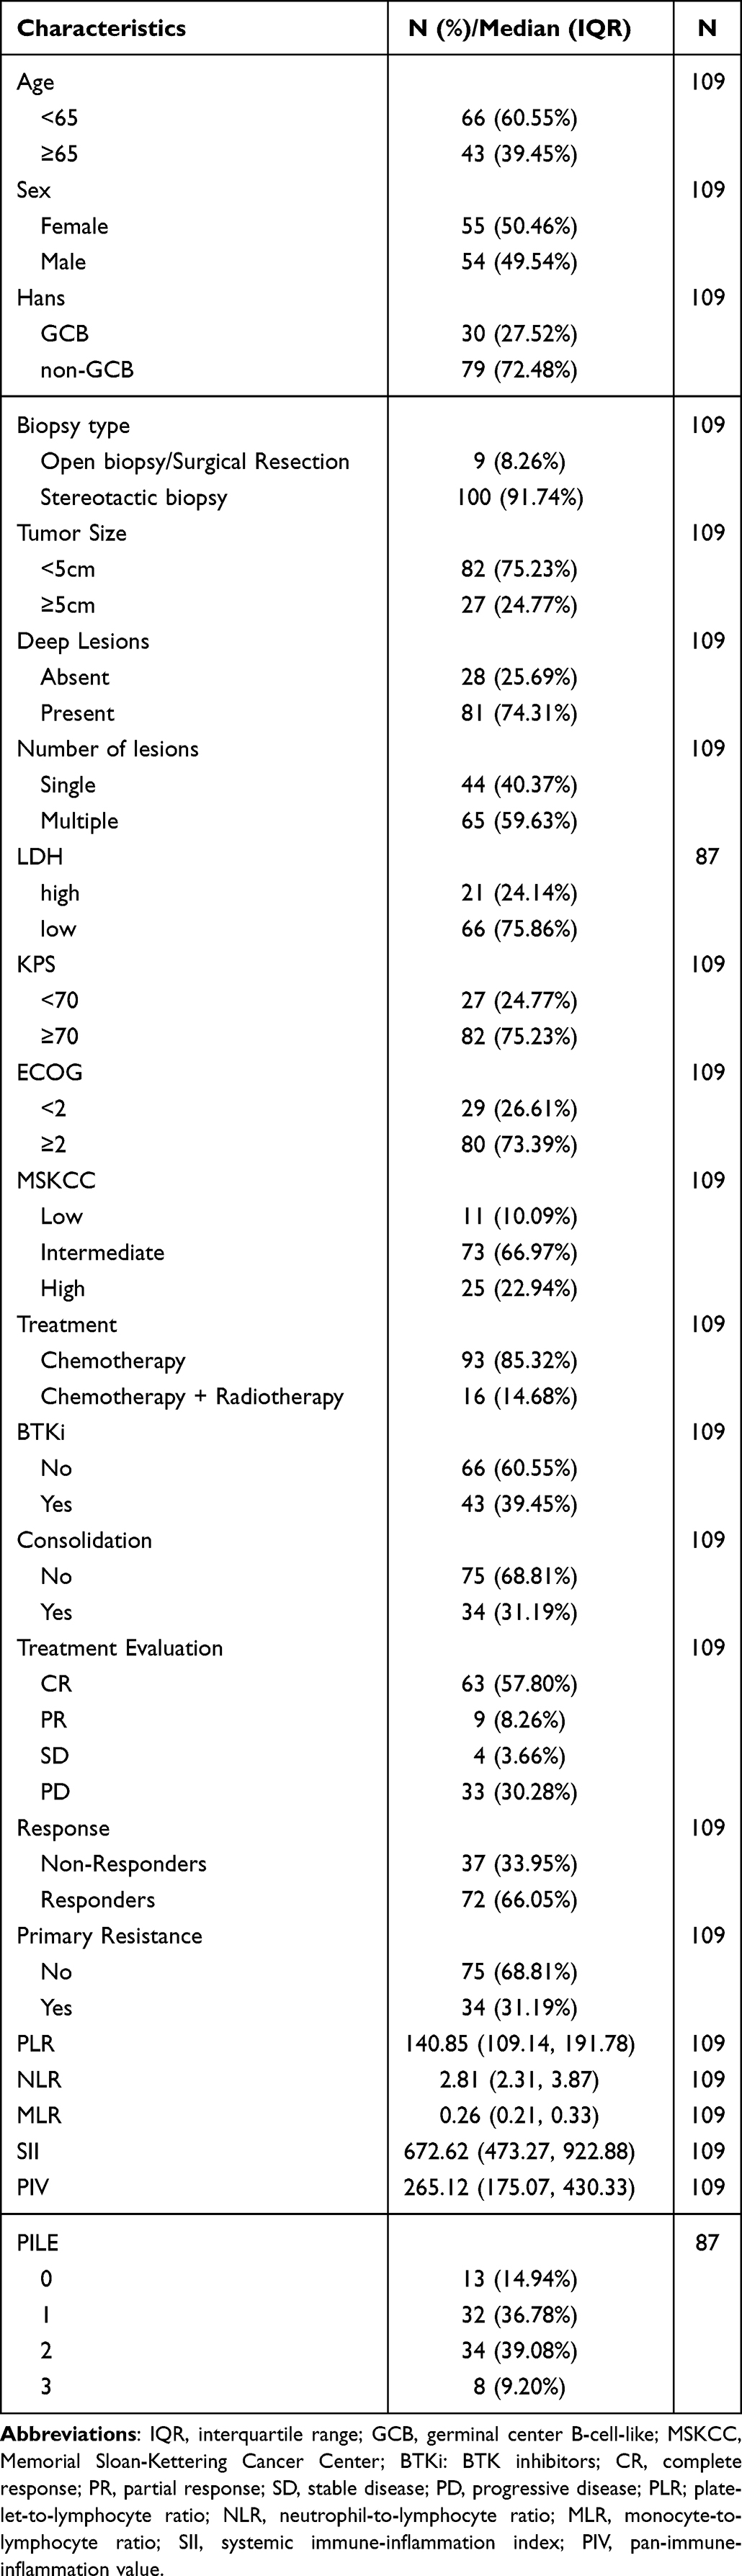 |
Table 1 Clinical Characteristics of the Entire Cohort |
The distribution of NLR, PLR, MLR, SII, and PIV was presented using dot plots and histograms (Supplementary Figure 2A–E), showing a skewed distribution. Among 109 patients included in the analysis, the median baseline PIV was 265.12 (IQR, 175.07–430.33), the median baseline PLR was 140.85 (IQR, 109.14–191.78), median baseline NLR was 2.81 (IQR, 2.31–3.87), median baseline MLR was 0.26 (IQR, 0.21–0.33), and median baseline SII was 672.62 (IQR, 473.27–922.88).
Impact of Systemic Inflammation Parameters on OS
A total of 32 (29.36%) patients died, and the median OS was 36.87 (95% CI, 26.13-NR) months (Supplementary Figure 1B). In this study, we used OS as the endpoint of interest, and maximally selected rank statistics were performed to determine the optimal cut-off value, with the function “surv_cutpoint” from the survminer R package.19,26 As displayed in Supplementary Figure 3A–E, the optimal cut-off values for NLR, PLR, MLR, SII, and PIV were 4.31, 83.83, 0.37, 995.16, and 672.65, respectively. Patients with high baseline PIV had significantly shorter OS than low PIV (median OS: 11.3, 95% CI 6.93–NR vs NR months, 95% CI 34.07–NR, p < 0.001) (Figure 1A). High PLR and NLR were also significantly associated with OS. Median OS was not reached (95% CI: 36.87-NR) in patients with high baseline PLR, while it was 26.10 months (95% CI: 5.27-NR) in patients with low PLR (p = 0.002) (Supplementary Figure 4A). As for NLR, the median OS was 23.8 months (95% CI, 11.30-NR) in patients with high NLR when compared with not reached (95% CI: 26.10-NR) in patients with low NLR (p = 0.043) (Supplementary Figure 4B). MLR and SII were not significantly associated with OS (Supplementary Figure 4C and D).
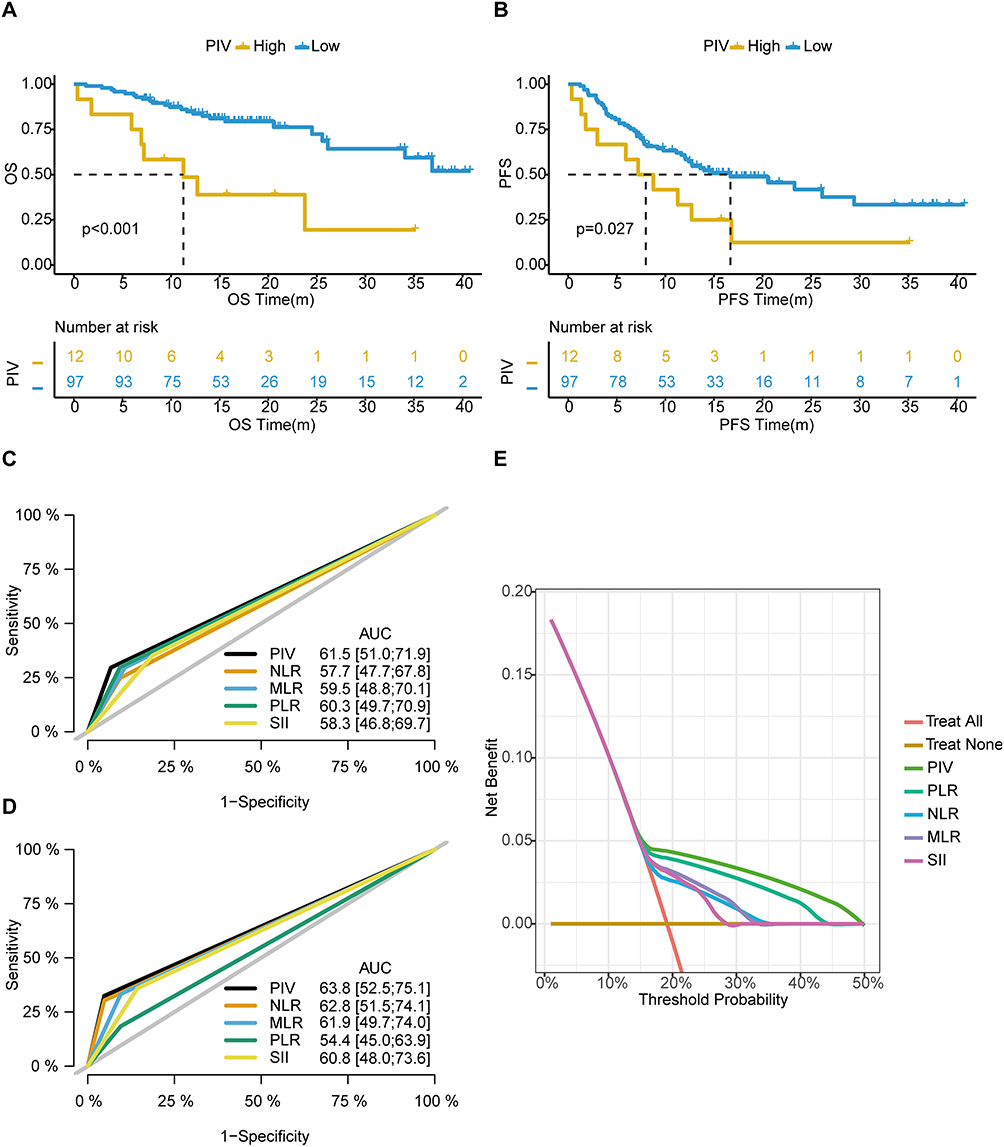 |
Figure 1 The association between PIV and clinical outcomes. (A) Kaplan-Meier curves for overall survival (OS) according to baseline PIV. (B) Kaplan-Meier curves for progression-free survival (PFS) according to baseline PIV. (C) The time-independent Receiver Operating Characteristic Curve (ROC) curves for the 1-year OS of different systemic inflammation parameters. (D) The time-independent ROC curves for the 2-year OS of different systemic inflammation parameters. (E) Decision curve analysis of OS for different parameters predicting OS. |
In the univariate Cox analysis, the PIV, PLR, and KPS were significantly associated with OS. (Table 2, p < 0.05). Multivariate Cox regression analysis was performed, adjusting for clinicopathological variables. As shown in Table 2, high PIV (HR 3.047, 95% CI 1.175–7.897, p = 0.022) and PLR (HR 0.223, 95% CI 0.096–0.522, p < 0.001) were independently associated with OS. In addition, time-dependent receiver operating characteristic (ROC) curves demonstrated that during 1- and 2-year follow-ups, the Area Under Curve (AUC) values of PIV are 0.615 (95% CI 0.510–0.719) and 0.638 (95% CI 0.525–0.751), respectively, which outperform other systemic inflammation parameters (Figure 1C and D). The decision curve analysis (DCA) notably showed that PIV has a higher overall net benefit than NLR, PLR, MLR, and SII in predicting OS (Figure 1E).
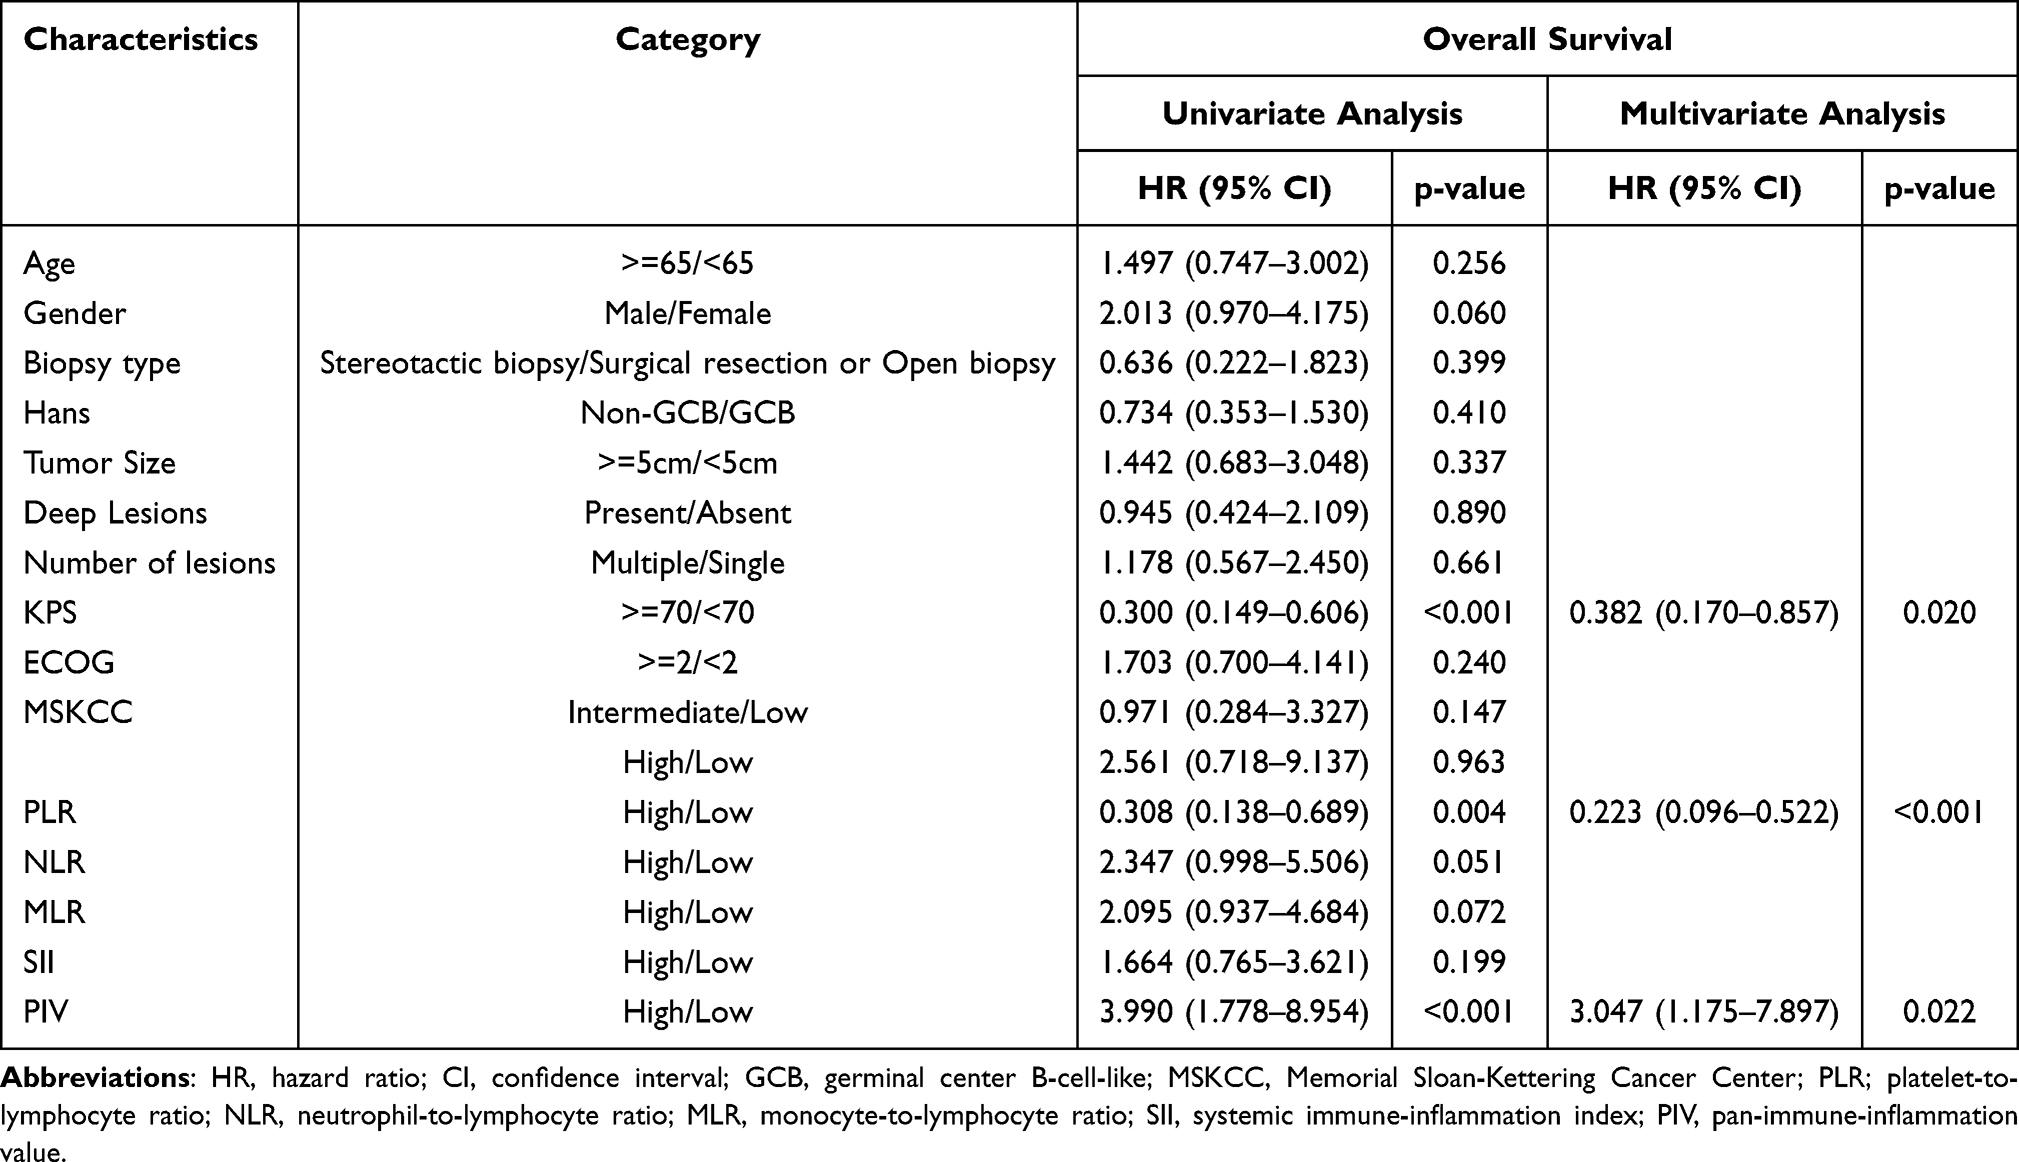 |
Table 2 Univariate and Multivariate Cox Analyses of Overall Survival |
Impact of Systemic Inflammation Parameters on PFS
A total of 60 (55.05%) patients progressed, and the median PFS was 14.00 (95% CI, 11.63–26.13) months (Supplementary Figure 1C). As shown in Figure 1B, compared with patients with low PIV, worse PFS could be observed in patients with high PIV (median PFS: 16.70, 95% CI 12.10-NR vs 7.98 months, 95% CI 3.00-NR, p = 0.027). PFS was significantly longer in patients with low baseline NLR as compared to high NLR (median PFS: 20.6 months, 95% CI 12.70-NR vs 7.1 months, 95% CI 3.9-NR, p < 0.001) (Supplementary Figure 4F). On the contrary, other immune-related parameters (PLR, MLR, and SII) were found to have no significant association with PFS (Supplementary Figure 4E, G and H). NLR and PIV were associated with worse PFS at univariate analysis (Table 3, HR > 1, p < 0.05). In the multivariable analysis, high NLR (HR 2.54, 95% CI, 1.25–5.15, p = 0.010) were independently associated with worse PFS, while high PIV did not show a statistically significant association with worse PFS (HR 1.32, 95% CI 0.60–2.91; p = 0.489) (Table 3).
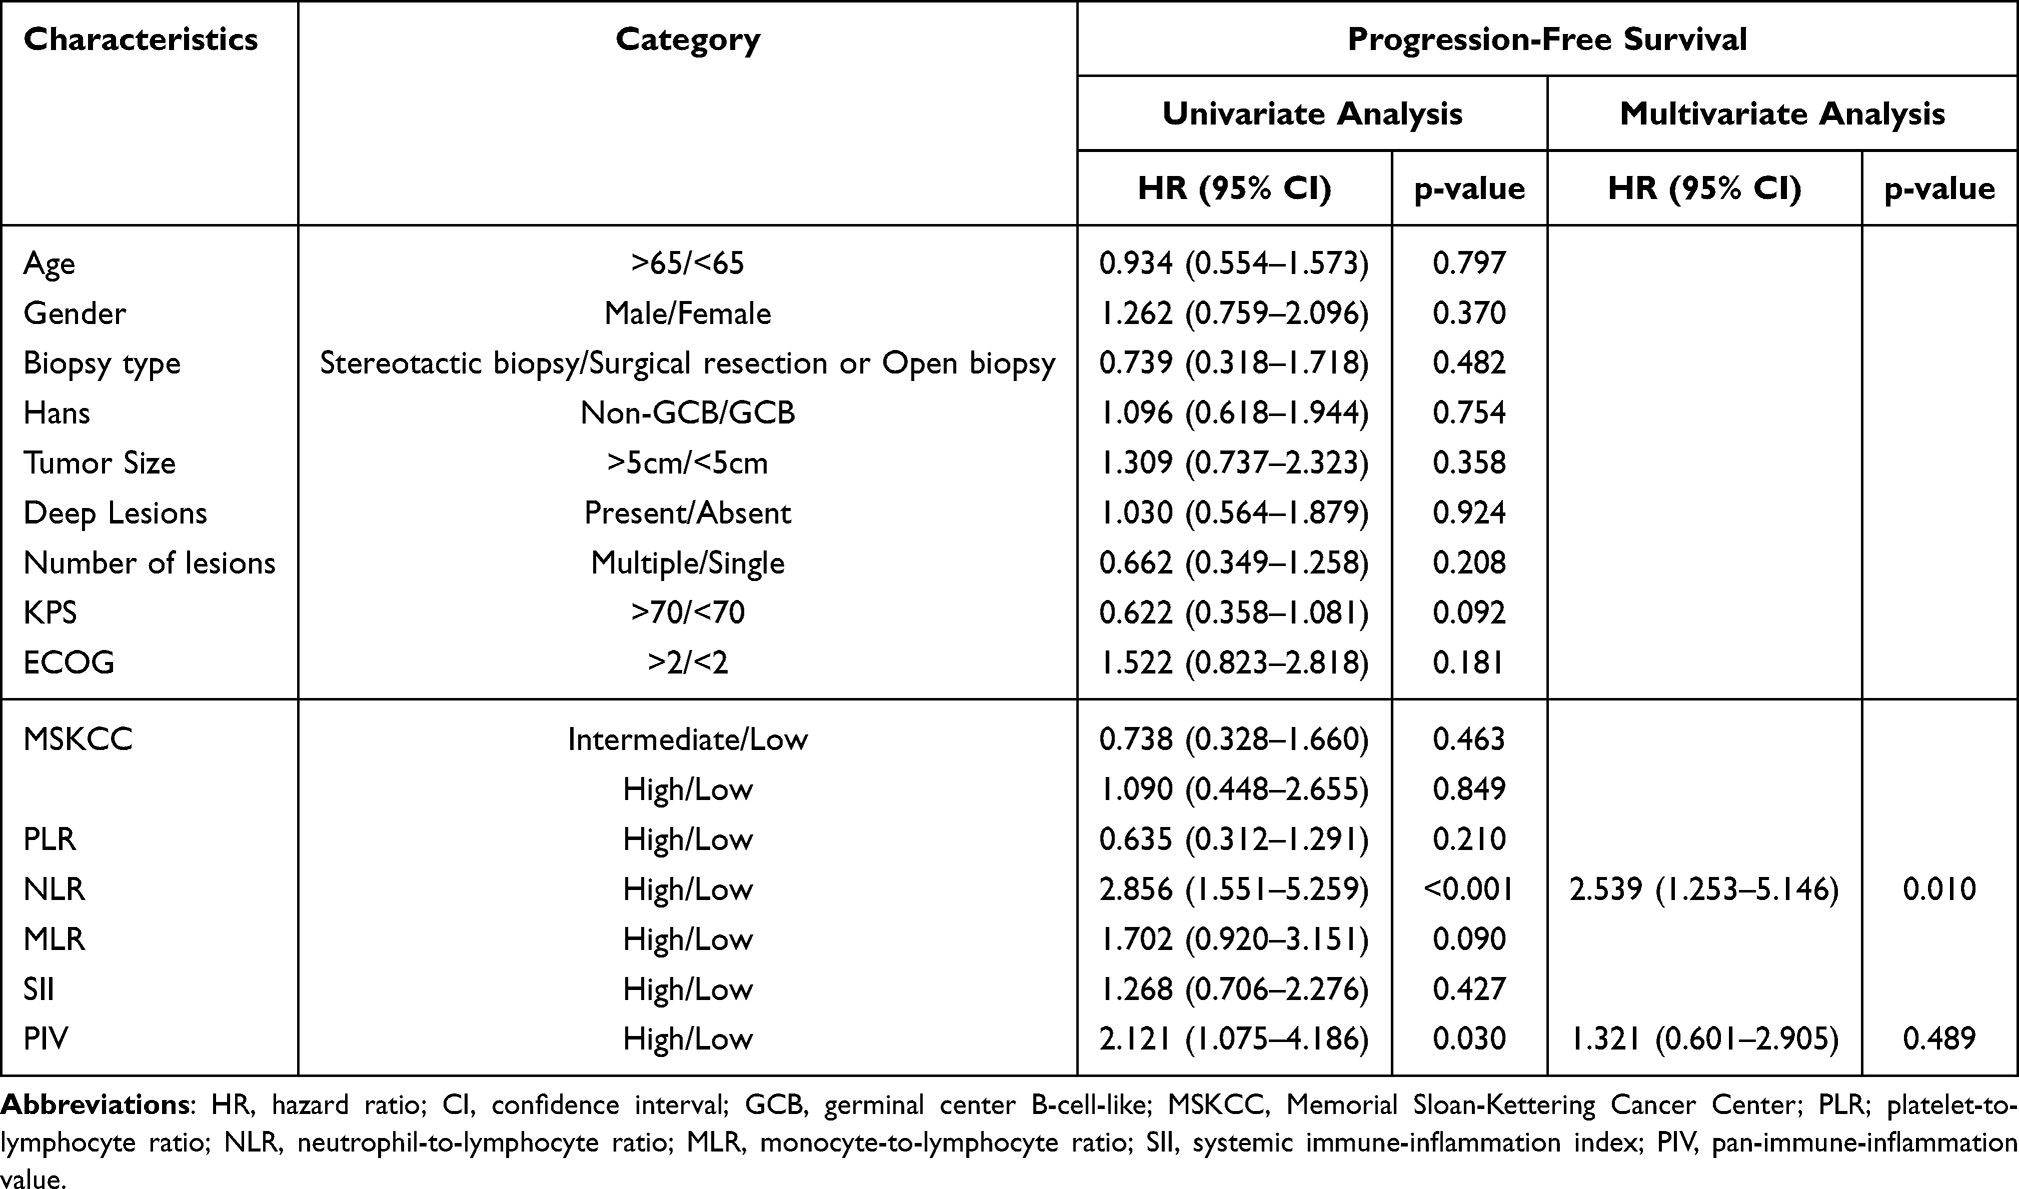 |
Table 3 Univariate and Multivariate Cox Analyses of Progression-Free Survival |
Prognostic Performance of PILE Score
The PILE score was described in the Methods (for PIV < median = 0, ≥median = 1; for LDH ≤ULN = 0, >ULN = 1; for ECOG PS <2 = 0, ≥2 = 1), and it was calculated with the sum of individual parameters and ranged from 0 to 3. Since the baseline LDH of only 87 patients in the cohort was available, PILE was calculated according to this. The PILE scores were 0, 1, 2, and 3 in 13 (14.94%), 32 (36.78%), 34 (39.08%), and 8 (9.20%) patients. Interestingly, we found that patients with a PILE score of 0 had the best OS and patients with a PILE score of 3 had the worst OS, whereas patients with a PILE score of 1 and 2 had an intermediate OS (Figure 2A, p < 0.001). Patients in four groups also demonstrated significantly different PFS (Figure 2B, p < 0.001). A total of 45 (51.72%) patients were in the low PILE group (PILE = 0–1), and 42 (48.28%) patients were in the high PILE group (PILE = 2–3). Significantly shorter OS and PFS were observed in the high PILE group (median OS: 25.60, 95% CI 15.60-NR vs NR months, 95% CI 26.10-NR, p = 0.008; median PFS: 26.13, 95% CI 23.30-NR vs 7.13 months, 95% CI 4.87-NR, p < 0.001) (Figure 2C and D). All survival analysis results about systemic inflammation parameters were summarized in Supplementary Table 1.
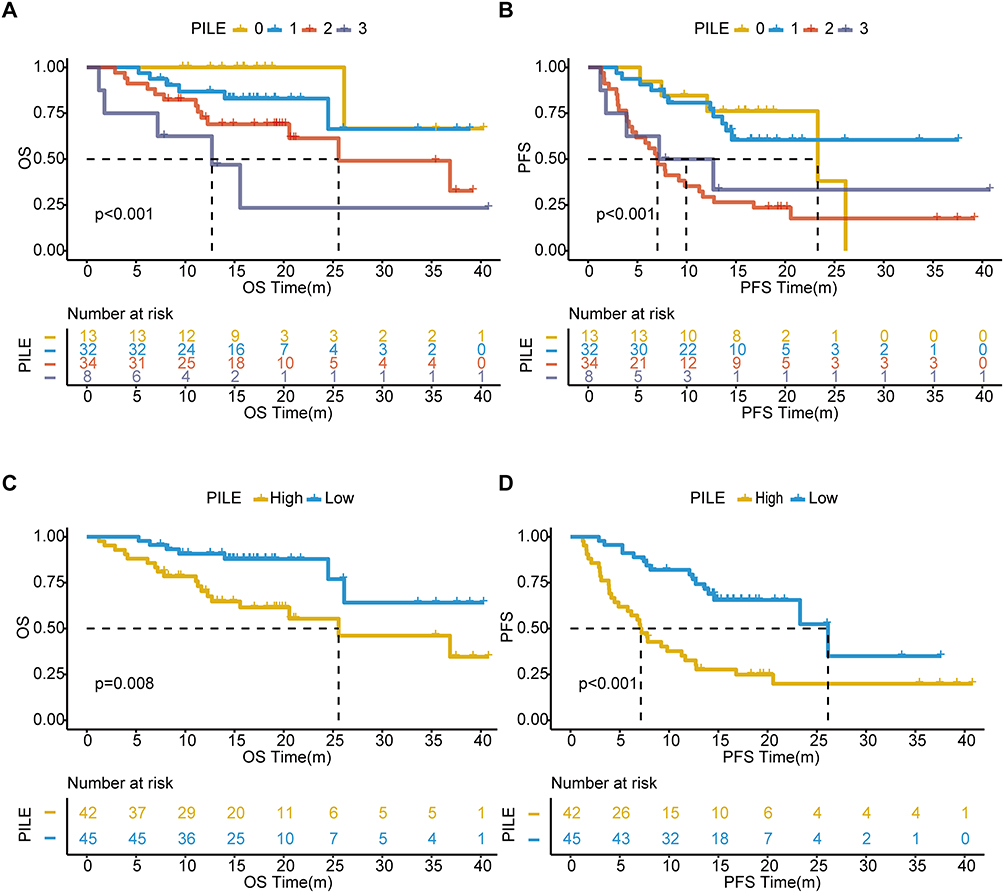 |
Figure 2 The association between PILE and clinical outcomes. (A) Kaplan-Meier curves for overall survival (OS) according to different PILE scores. (B) Kaplan-Meier curves for progression-free survival (PFS) according to different PILE scores. (C) Kaplan-Meier curves for OS according to PILE category. (D) Kaplan-Meier curves for PFS according to PILE category. |
We further conducted the Kaplan-Meier survival curves of PILE in different subgroups based on the clinical factors. High PILE showed significantly worse OS in almost all subgroup analyses, especially in subgroups such as Age<65 (Supplementary Figure 5A, p = 0.020), Male (Supplementary Figure 5B, p = 0.003), GCB subtype (Supplementary Figure 5C, p = 0.011), Tumor large size (Supplementary Figure 5D, p = 0.031), Deep lesions (Supplementary Figure 5E, p = 0.012), Multiple lesions (Supplementary Figure 5F, p = 0.021), ECOG ≥2 (Supplementary Figure 5H, p = 0.015), MSKCC low and high-risk (Supplementary Figure 5I, p = 0.046, p = 0.043). More importantly, high PILE was significantly associated with worse PFS in almost all subgroups (Supplementary Figure 6A–I). The PILE remained a significant prognostic indicator after stratification by clinicopathological variables, indicating the independent association of the PILE with the prognosis. Additionally, we also performed the univariate and multivariate Cox analysis on PILE and clinical factors in the PILE cohort (N=87). In the univariate Cox analysis, the KPS, PLR, PIV, and PILE were significantly associated with OS. (Supplementary Table 2, p<0.05). Multivariate Cox regression analysis was performed, adjusting for clinicopathological variables. High PILE (HR 3.036, 95% CI 1.122–8.217, p = 0.029), KPS≥70 (HR 0.177, 95% CI 0.079–0.392, p = 0.001), and high PLR (HR 0.177, 95% CI 0.062–0.504, p = 0.001) were independently associated with OS. Moreover, High PILE (HR 2.972, 95% CI 1.548–5.706, p = 0.001) and high NLR (HR 2.057, 95% CI 1.022–6.148, p = 0.029) were confirmed to be an independent indicator of PFS (Supplementary Table 3). The ROC curves demonstrated that the AUCs of PILE for predicting OS and PFS are 0.678 (95% CI 0.520–0.835) and 0.745 (95% CI 0.650–0.840), respectively, which is better than PIV alone (Supplementary Figure 7A and B). The PILE was incorporated into a score, showing a significant improvement in the survival prediction of OS and PFS.
Relationships Between PIV, PILE, and Therapeutic Response
The distributions of PIV among different clinical groups are shown in Supplementary Table 4. Figure 3A shows the distribution of the best response according to baseline PIV in patients. When considered as a continuous variable, PIV was higher in patients with primary tumor resistance (median PIV: 385.71, IQR 187.17–477.56 vs median PIV 240.02, IQR 167.67–370.03 in patients not experiencing primary resistance; p = 0.025) (Figure 3C). Moreover, patients who responded to initial treatment had lower PIV than Non-Responders (median PIV in Responders: 240.02; IQR 167.67–370.03 vs median PIV in Non-Responders: 372.46; IQR 182.79–477.56; p = 0.030) (Figure 3E). Accordingly, patients in the high PIV group experienced a higher rate of primary tumor resistance and Non-Responders (50.00% and 58.33%) than low PIV group (28.87% and 30.93%) (Figure 3B, D and F), although no significant differences.
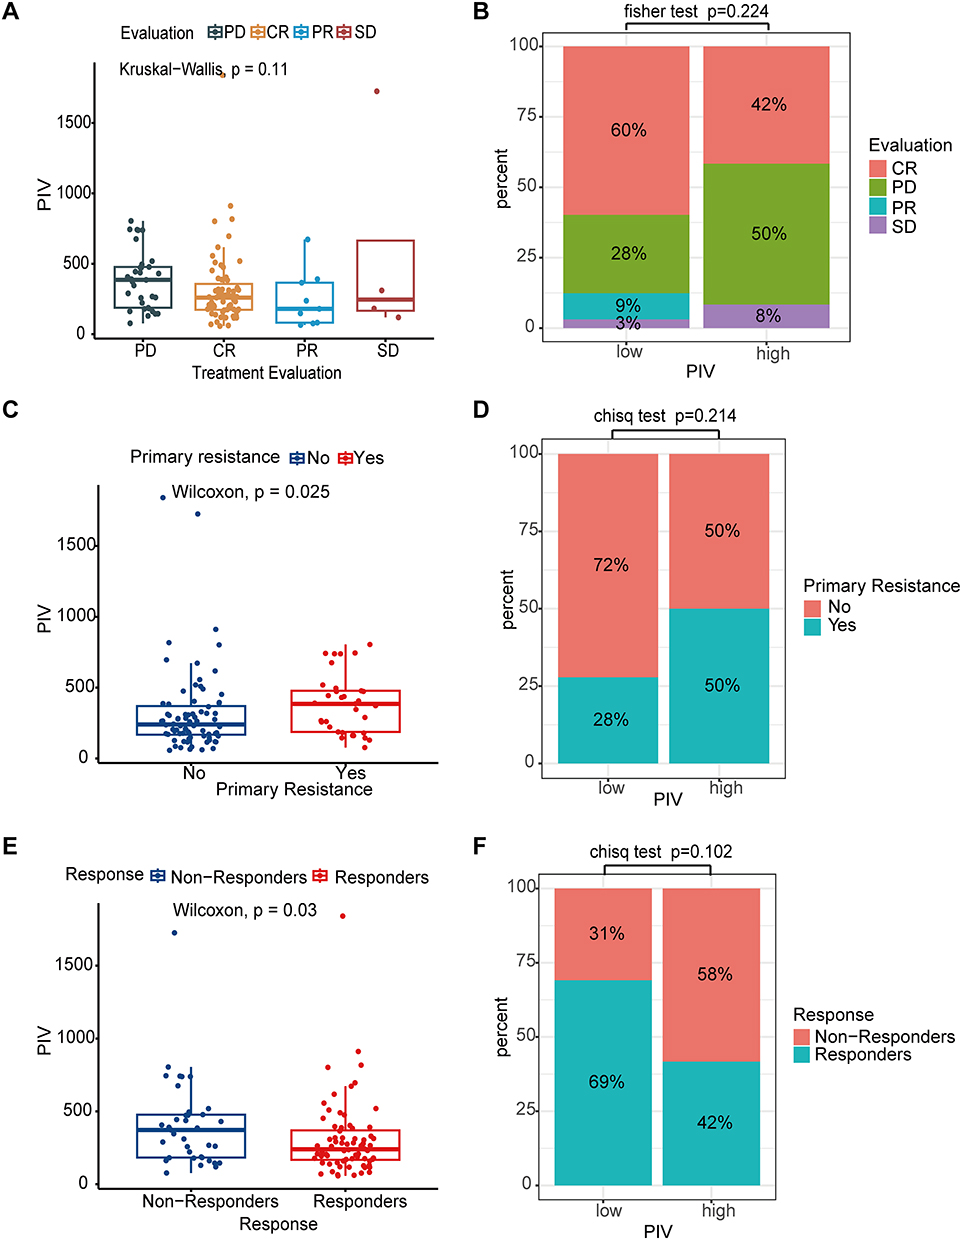 |
Figure 3 The relations between PIV and treatment response. (A) The distribution of PIV according to the treatment evaluation in the entire cohort. (B) Distribution of patients in complete remission (CR)/partial remission (PR)/stable disease (SD)/progressive disease (PD) between PIV groups. (C) The distribution of PIV according to primary resistance. (D) Distribution of patients who are primarily resistant to treatment between PIV groups. (E) Comparisons of the PIV value in Responders and Non-responders. (F) Distribution of Non-Responders/Responders between PIV groups. |
We also explored the association between PILE and clinical characteristics (Table 4). Figure 4A shows the treatment response distribution according to patients’ PILE scores. High PILE was associated with primary resistance to therapy (high PILE group: 21/42 patients, 50.00%; low PILE group: 5/45 patients, 11.11%; p < 0.001) (Figure 4B). A significantly lower response rate to initial treatment was found in patients in the high PILE group (23/42, 54.76%) as compared to patients in the low PILE group (7/45, 15.56%; p < 0.001) (Figure 4C). We performed the univariate and multivariate logistic regression analyses using treatment response as the endpoint of interest. Among all the baseline variables examined in multivariate analysis, PILE was independently associated with Responders (odds ratio (OR) 0.17, 95% CI 0.05–0.46; p < 0.001) (Table 5). Furthermore, the AUC values of PILE predicting treatment response were 0.713, outperforming other systemic inflammation parameters (Figure 4D). Notably, the DCA curve showed that PILE has a better overall net benefit than others in predicting treatment response (Figure 4E).
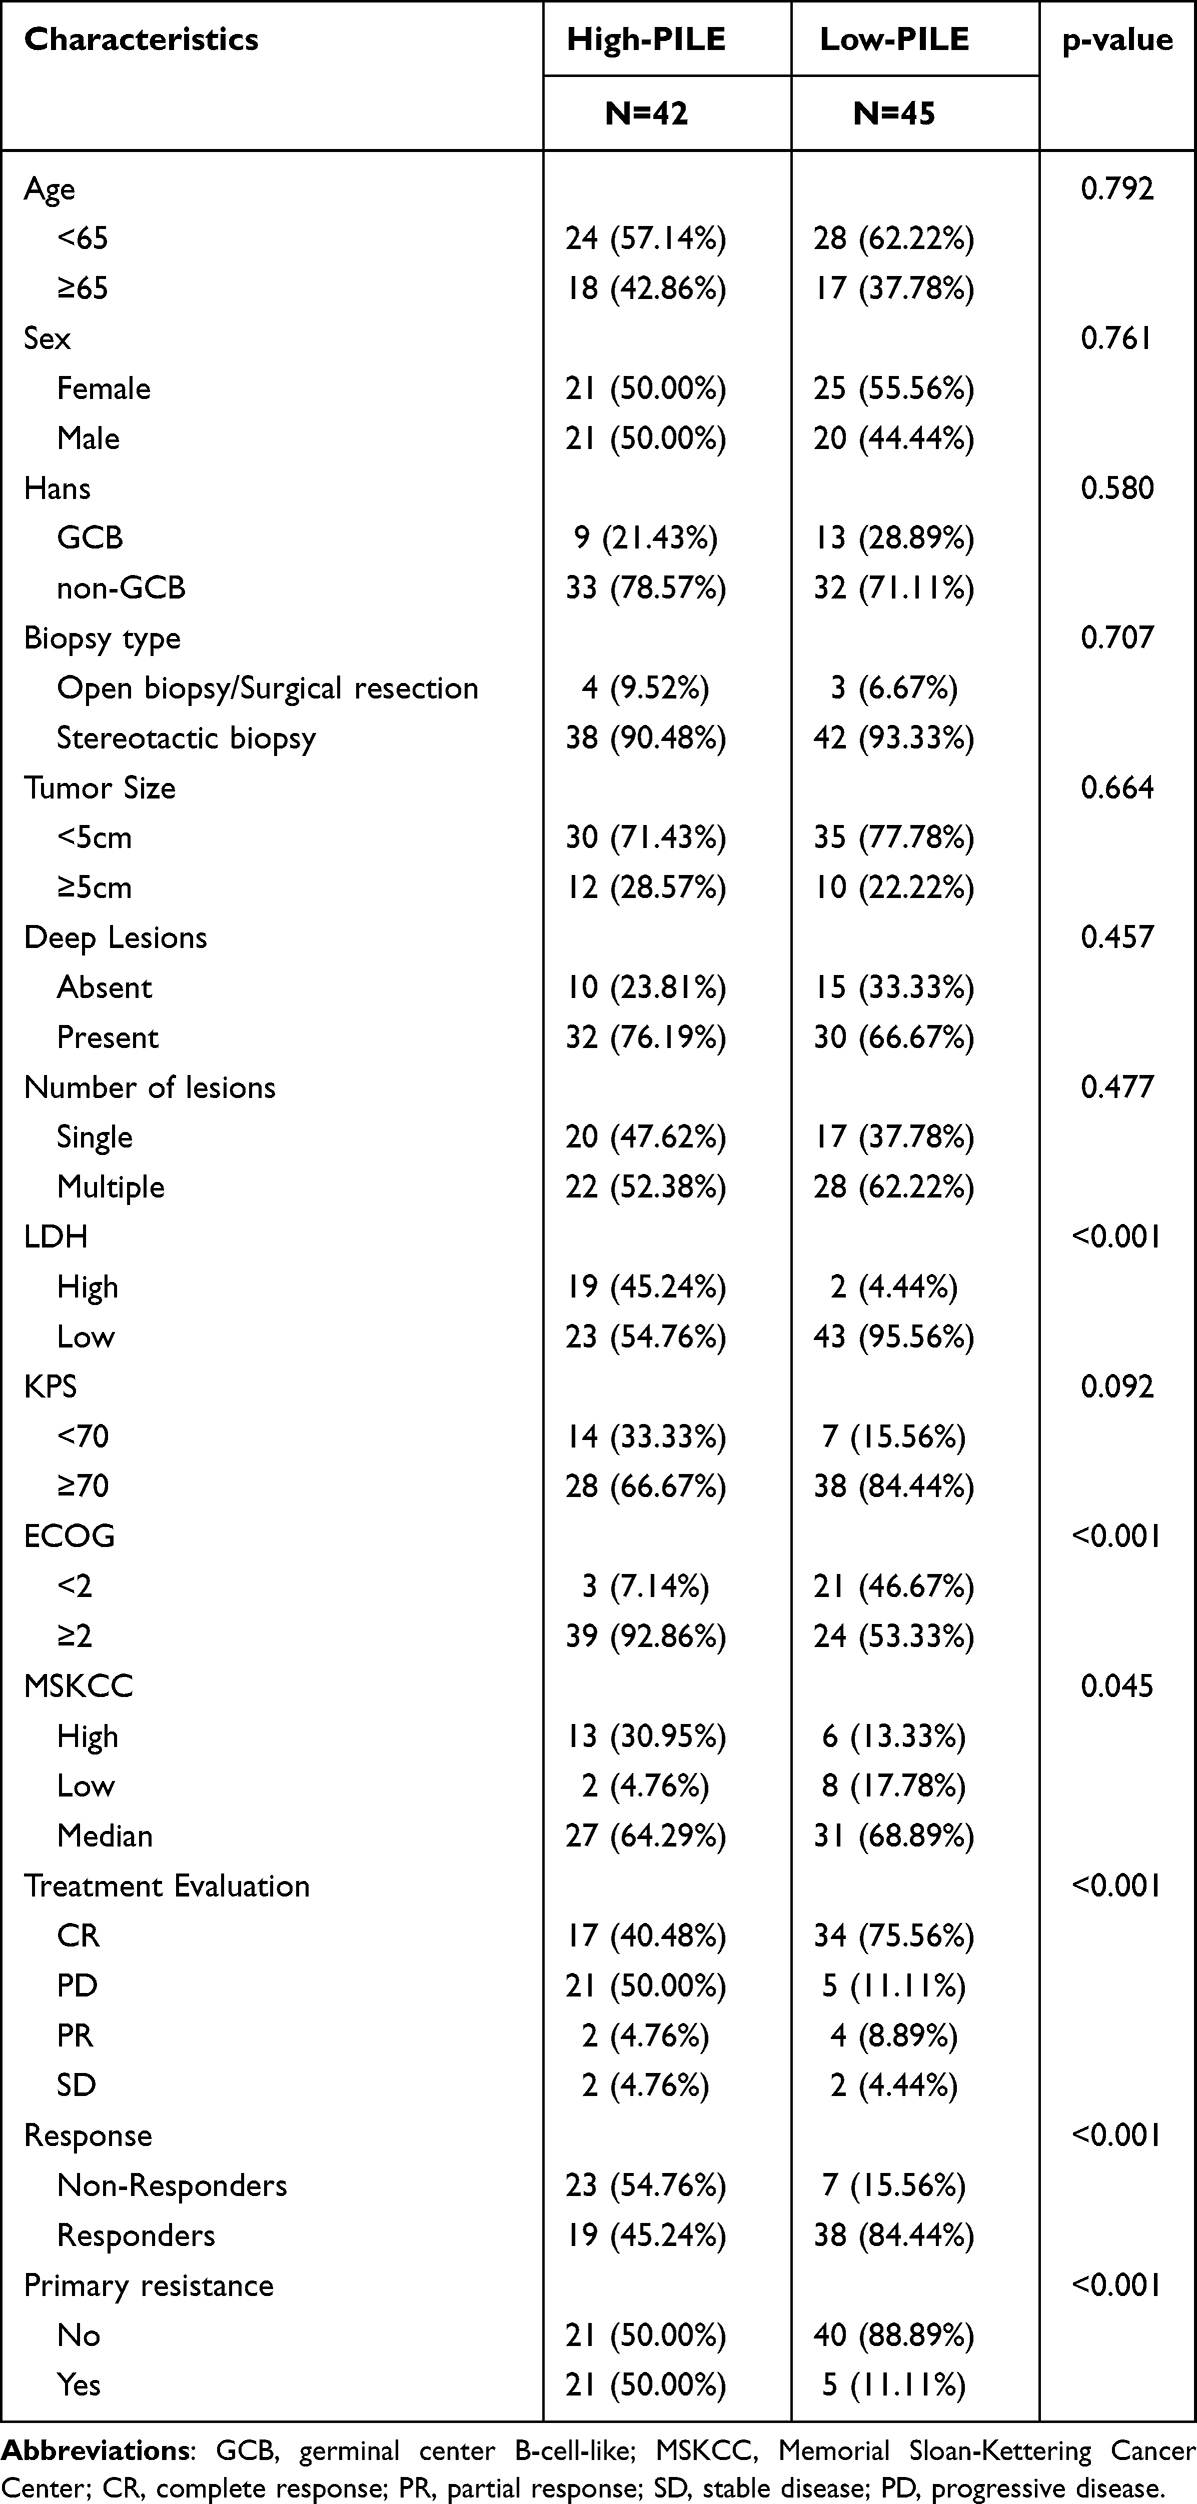 |
Table 4 Patients’ Characteristics According to PILE Group |
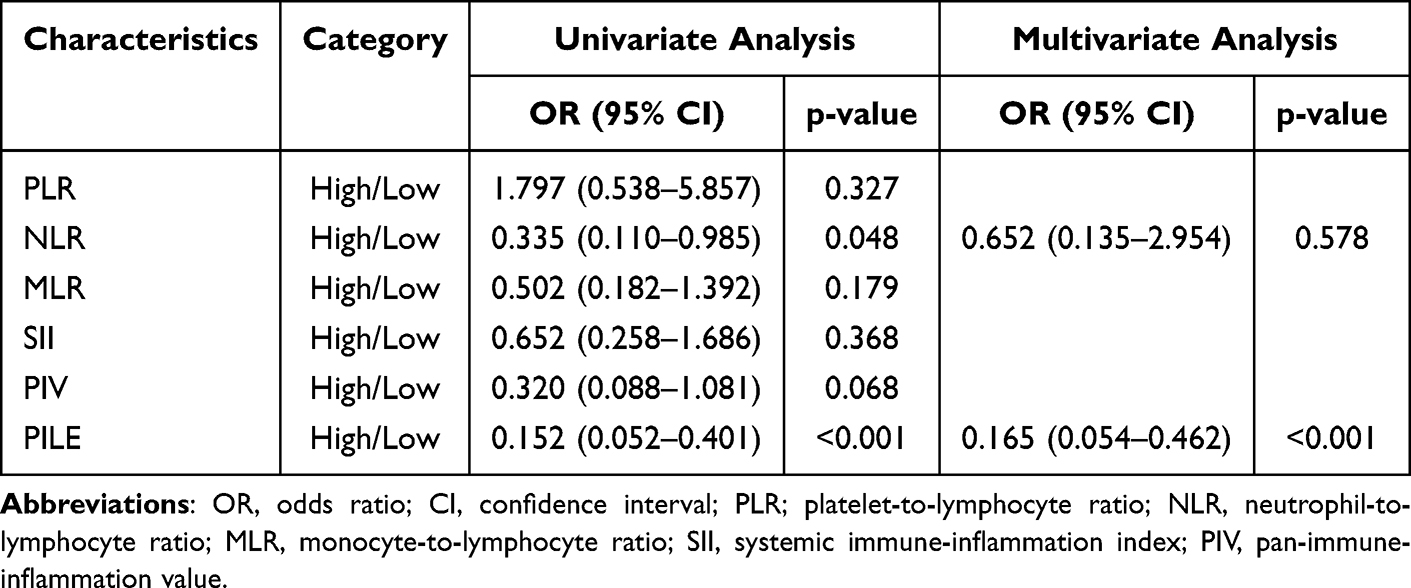 |
Table 5 Univariate and Multivariate Logistic Regression Analyses of Therapeutic Response |
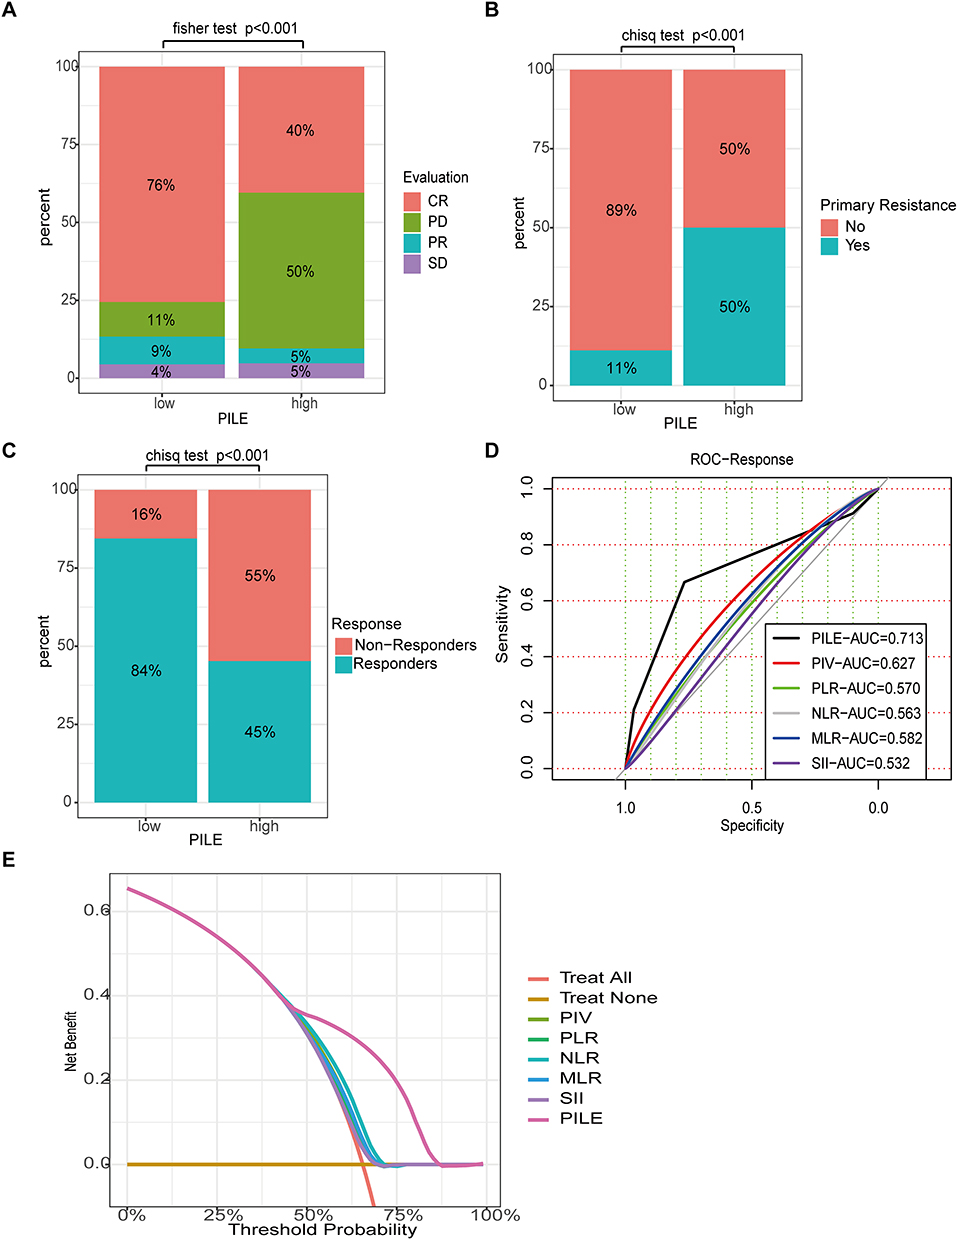 |
Figure 4 The relations between PILE and treatment response. (A) Distribution of patients in complete remission (CR)/partial remission (PR)/stable disease (SD)/progressive disease (PD) between PILE groups. (B) Distribution of patients who are primarily resistant to treatment between PILE groups. (C) Distribution of Non-Responders/Responders between PILE groups. (D) The time-independent ROC curves for treatment response of different systemic inflammation parameters. (E) Decision curve analysis of treatment response for different parameters predicting OS. |
Discussion
The prognosis prediction of PCNSL is still challenging, and the optimal predictive biomarkers of PCNSL need to be validated and further improved based on the standard HD-MTX therapy. Our study retrospectively analyzed the prognostic role of baseline blood parameters in 109 PCNSL patients with initial treatment. Here, we demonstrated that a new immune-inflammation blood-based biomarker, the PIV, has independent prognostic value in patients with PCNSL and better predictive performance than other systemic inflammation parameters. High PIV at baseline was associated with worse OS and PFS. Moreover, our findings showed that PILE, which contains PIV, ECOG PS, and LDH levels, also predict PFS and OS. Of note, the PILE showed an independent association with clinical benefit, indicating the potential value of PILE as a predictor of therapeutic response.
Systemic inflammatory responses are reported to be a significant predictor of outcome and are likely to inform treatment decisions for various cancers.27 Routine hematological parameters have different roles in carcinogenesis and can reflect systemic and intratumor inflammatory status. Neutrophils28,29 and platelets30,31 are linked with critical tumor-promoting activities, including proliferation, invasion, and metastasis. On the contrary, lymphocytes are the main drivers of anti-tumor activity in the tumor microenvironment.32 It was reported that monocytes play a more complex role in the development of carcinogenesis.33 Besides, peripheral blood cells are cost-effective and readily available, increasing the potential for prognostic indicators. Several studies reported that NLR might potentially be prognostic in PCNSL.34,35 Our study also found that NLR is associated with survival outcomes and, more importantly, is an independent indicator of PFS. In a recent study, NLR, PLR, and SII were found to serve as prognostic indicators for PCNSL patients.36 Li et al proposed a new prognostic model using SII, age, and KPS that outperforms MSKCC alone and enables individualized estimates of patient outcomes.37 Our current study also confirmed that PLR is an independent factor for OS, while a significant association between SII and outcomes was not found in our cohort.
PIV was initially proposed in 2020 and was proven to have a substantial prognostic impact on metastatic colorectal cancer.19 After that, several studies revealed that PIV, as a new and more potent predictor, included four blood components (neutrophils, platelets, monocytes, and lymphocytes), and was strongly associated with the clinical outcomes of patients with several types of cancer.20,38–40 Despite the heterogeneity of PIV thresholds between studies, the predictive value of PIV has been recently validated in a meta-analysis of six colorectal cancer studies and another meta-analysis, including 15 studies of various cancers.21,41 Compared with individual blood cell parameters, PIV might be able to comprehensively capture the complexity of the systemic immune and inflammatory status, which explains why PIV outperformed other well-established immune-inflammatory biomarkers. Likewise, in our study, patients with high PIV had significantly worse OS and PFS than those with low PIV. For the first time, we determined that PIV is a prognostic indicator for both PFS and OS in univariate analysis and highly significant for OS in multivariate analysis but not significantly independent of PFS in PCNSL. In terms of OS in patients with PCNSL in this study, PIV indicated the most vital predictive power among the widely used systemic inflammation parameters. Moreover, several studies reported that PIV predicts immunotherapy and chemotherapy treatment responses in various cancers.39,42,43 Similarly, our study also demonstrated that patients who responded to initial treatment have lower PIV than Non-Responders, which needs to be validated in a larger sample cohort.
The PILE score was previously used by Guven et al to predict survival responses in patients receiving immunotherapy for various cancers.22 It is a novel, simple scoring system consisting of PIV, LDH, and ECOG PS. Another study on patients with Extensive-Stage Small Cell Lung Cancer (ES-SCLC) proved that high PILE predicts poorer treatment response and survival outcomes.23 Karadağ et al also demonstrated that PILE scores can be used as prognostic biomarkers at the time of diagnosis in Hepatocellular carcinoma.44 As for PCNSL, the ECOG PS are universally accepted prognostic parameters for PCNSL. In four studies, ECOG PS ≥ 2 has been confirmed to be a negative prognostic parameter.45–48 High LDH serum level was associated with a lower response rate and poor prognosis and was eventually incorporated into the International Extranodal Lymphoma Study Group (IELSG) prognostic model.47 We have reasons to believe that the PILE score combining PS, LDH, and PIV has a specific potential value in PCNSL. Our study revealed that the PILE score is associated with poorer PFS and OS in the high-risk group than in the low-risk group. More importantly, we demonstrated that high PILE is associated with primary resistance to therapy and a significantly lower response rate to initial treatment. In addition, PILE was independently associated with treatment response in the multivariate logistic analysis and showed a more substantial predictive power and a better overall net benefit than other parameters.
To our knowledge, this is the first study to evaluate the predictive and prognostic abilities of baseline PIV in patients with PCNSL. Moreover, we explored the performance of PILE, a potential prognostic score based on PIV, LDH, and ECOG PS. Our study demonstrated that PIV and PILE can predict clinical outcomes in PCNSL patients.
Nevertheless, our study has several limitations. First, the retrospective nature of data collection may influence its reproducibility and generalization. Second, considering the low incidence of PCNSL, one major limitation of the present study is the small sample size and lack of validation in the large external cohort. A multicenter prospective study is thus warranted in the future to consolidate our findings. Third, the blood-based biomarkers could be influenced by various unidentified factors, such as immune status and glucocorticoid treatment, which could bring bias to results. Further studies are needed to confirm the role of PIV and PILE in PCNSL patients. Despite the requirement for a large sample independent prospective multicenter validation cohort, the decision curve analysis in this study, which evaluates the clinical utility without additional validation data, indicates that the PIV and PILE have considerable potential in clinical applications for patient prognosis and treatment response prediction.
Conclusion
In summary, in the present study, we identified baseline PIV as an immune–inflammation biomarker strongly correlated with OS and PFS in PCNSL patients. Notably, PIV outperforms NLR, PLR, MLR, and SII in predicting OS. PILE, a score based on PIV, LDH, and ECOG PS, was an influential factor for survival outcomes and therapeutic response in PCNSL, indicating that PIV and PILE might be useful in identifying patients unlikely to benefit from initial treatment. Further large sample and prospective studies are necessary to validate our conclusions.
Data Sharing Statement
All data and material analyzed during this study are included in this article/Supplementary File. Further data are available upon reasonable request to the corresponding author.
Ethics Approval and Informed Consent
This study was approved by the Institutional Review Board of Beijing Tiantan Hospital (approval number: 2020-059 YW), and informed consent was obtained from all the patients. This study was performed in accordance with the Helsinki Declaration.
Author Contributions
All authors made a significant contribution to the work reported, whether that is in the conception, study design, execution, acquisition of data, analysis and interpretation, or all these areas; took part in drafting, revising, or critically reviewing the article; gave final approval of the version to be published; have agreed on the journal to which the article has been submitted; and agree to be accountable for all aspects of the work.
Funding
This study was supported by the Clinical Major Specialty Projects of Beijing (2-1-2-038) and the National Key Research & Development Program of China (No. 2021YFF0901404).
Disclosure
The authors report no conflicts of interest in this work.
References
1. Villano JL, Koshy M, Shaikh H, Dolecek TA, McCarthy BJ. Age, gender, and racial differences in incidence and survival in primary CNS lymphoma. Br J Cancer. 2011;105(9):1414–1418. doi:10.1038/bjc.2011.357
2. Ostrom QT, Gittleman H, Liao P, et al. CBTRUS statistical report: primary brain and other central nervous system tumors diagnosed in the United States in 2010–2014. Neuro-Oncology. 2017;19(suppl_5). doi:10.1093/neuonc/nox158
3. Mendez JS, Ostrom QT, Gittleman H, et al. The elderly left behind-changes in survival trends of primary central nervous system lymphoma over the past 4 decades. Neuro-Oncology. 2018;20(5):687–694. doi:10.1093/neuonc/nox187
4. Shiels MS, Pfeiffer RM, Besson C, et al. Trends in primary central nervous system lymphoma incidence and survival in the U.S. Br J Haematol. 2016;174(3):417–424. doi:10.1111/bjh.14073
5. Radke J, Ishaque N, Koll R, et al. The genomic and transcriptional landscape of primary central nervous system lymphoma. Nat Commun. 2022;13(1):2558. doi:10.1038/s41467-022-30050-y
6. Ferreri AJM, Cwynarski K, Pulczynski E, et al. Chemoimmunotherapy with methotrexate, cytarabine, thiotepa, and rituximab (MATRix regimen) in patients with primary CNS lymphoma: results of the first randomisation of the international extranodal lymphoma study group-32 (IELSG32) Phase 2 trial. Lancet Haematol. 2016;3(5):e217–e227. doi:10.1016/S2352-3026(16)00036-3
7. Ferreri AJM, Reni M, Foppoli M, et al. High-dose cytarabine plus high-dose methotrexate versus high-dose methotrexate alone in patients with primary CNS lymphoma: a randomised phase 2 trial. Lancet. 2009;374(9700):1512–1520. doi:10.1016/S0140-6736(09)61416-1
8. Houillier C, Soussain C, Ghesquières H, et al. Management and outcome of primary CNS lymphoma in the modern era: an LOC network study. Neurology. 2020;94(10):e1027–e1039. doi:10.1212/WNL.0000000000008900
9. Houillier C, Dureau S, Taillandier L, et al. Radiotherapy or autologous stem-cell transplantation for primary CNS lymphoma in patients age 60 years and younger: long-term results of the randomized Phase II PRECIS study. J Clin Oncol. 2022;40(32):3692–3698. doi:10.1200/JCO.22.00491
10. DeAngelis LM, Seiferheld W, Schold SC, Fisher B, Schultz CJ. Combination chemotherapy and radiotherapy for primary central nervous system lymphoma: radiation therapy oncology group study 93–10. J Clin Oncol. 2002;20(24):4643–4648. doi:10.1200/JCO.2002.11.013
11. Poortmans PMP, Kluin-Nelemans HC, Haaxma-Reiche H, et al. High-dose methotrexate-based chemotherapy followed by consolidating radiotherapy in non-AIDS-related primary central nervous system lymphoma: European organization for research and treatment of cancer lymphoma group phase II trial 20962. J Clin Oncol. 2003;21(24):4483–4488. doi:10.1200/JCO.2003.03.108
12. Yuan X-G, Huang Y-R, Yu T, et al. Primary central nervous system lymphoma in China: a single-center retrospective analysis of 167 cases. Ann Hematol. 2019;99(1):93–104. doi:10.1007/s00277-019-03821-9
13. Panageas KS, Elkin EB, DeAngelis LM, Ben-Porat L, Abrey LE. Trends in survival from primary central nervous system lymphoma, 1975–1999: a population-based analysis. Cancer. 2005;104(11):2466–2472. doi:10.1002/cncr.21481
14. Duan L, He Y, Guo W, et al. Machine learning-based pathomics signature of histology slides as a novel prognostic indicator in primary central nervous system lymphoma. J Neuro-oncol. 2024;168(2):283–298. doi:10.1007/s11060-024-04665-8
15. Templeton AJ, McNamara MG, Šeruga B, et al. Prognostic role of neutrophil-to-lymphocyte ratio in solid tumors: a systematic review and meta-analysis. J Natl Cancer Inst. 2014;106(6):dju124. doi:10.1093/jnci/dju124
16. Jakubowska K, Koda M, Grudzińska M, Kańczuga-Koda L, Famulski W. Monocyte-to-lymphocyte ratio as a prognostic factor in peripheral whole blood samples of colorectal cancer patients. World J Gastroenterol. 2020;26(31):4639–4655. doi:10.3748/wjg.v26.i31.4639
17. Templeton AJ, Ace O, McNamara MG, et al. Prognostic role of platelet to lymphocyte ratio in solid tumors: a systematic review and meta-analysis. Cancer Epidemiol Biomark Prev. 2014;23(7):1204–1212. doi:10.1158/1055-9965.EPI-14-0146
18. Wang H-B, X-T X, Tian M-X, et al. Prognostic values of the prognostic nutritional index, geriatric nutritional risk index, and systemic inflammatory indexes in patients with stage IIB-III cervical cancer receiving radiotherapy. Front Nutr. 2023;10:1000326. doi:10.3389/fnut.2023.1000326
19. Fucà G, Guarini V, Antoniotti C, et al. The pan-immune-inflammation value is a new prognostic biomarker in metastatic colorectal cancer: results from a pooled-analysis of the valentino and TRIBE first-line trials. Br J Cancer. 2020;123(3):403–409. doi:10.1038/s41416-020-0894-7
20. Ligorio F, Fuca G, Zattarin E, et al. The pan-immune-inflammation-value predicts the survival of patients with human epidermal growth factor receptor 2 (HER2)-positive advanced breast cancer treated with first-line taxane-trastuzumab-pertuzumab. Cancers. 2021;13(8):1964. doi:10.3390/cancers13081964
21. Guven DC, Sahin TK, Erul E, Kilickap S, Gambichler T, Aksoy S. The association between the pan-immune-inflammation value and cancer prognosis: a systematic review and meta-analysis. Cancers. 2022;14(11):2675. doi:10.3390/cancers14112675
22. Guven DC, Yildirim HC, Bilgin E, et al. PILE: a candidate prognostic score in cancer patients treated with immunotherapy. Clin Transl Oncol. 2021;23(8):1630–1636. doi:10.1007/s12094-021-02560-6
23. Zeng R, Liu F, Fang C, et al. PIV and PILE score at baseline predict clinical outcome of Anti-PD-1/PD-L1 inhibitor combined with chemotherapy in extensive-stage small cell lung cancer patients. Front Immunol. 2021;12:724443. doi:10.3389/fimmu.2021.724443
24. Abrey LE, Ben-Porat L, Panageas KS, et al. Primary central nervous system lymphoma: the memorial sloan-kettering cancer center prognostic model. J Clin Oncol. 2006;24(36):5711–5715. doi:10.1200/JCO.2006.08.2941
25. Abrey LE, Batchelor TT, Ferreri AJM, et al. Report of an international workshop to standardize baseline evaluation and response criteria for primary CNS lymphoma. J Clin Oncol. 2005;23(22):5034–5043. doi:10.1200/JCO.2005.13.524
26. Hothorn T, Zeileis A. Generalized maximally selected statistics. Biometrics. 2008;64(4):1263–1269. doi:10.1111/j.1541-0420.2008.00995.x
27. Dolan RD, McSorley ST, Horgan PG, Laird B, McMillan DC. The role of the systemic inflammatory response in predicting outcomes in patients with advanced inoperable cancer: systematic review and meta-analysis. Crit Rev Oncol Hematol. 2017;116:134–146. doi:10.1016/j.critrevonc.2017.06.002
28. Dumitru CA, Lang S, Brandau S. Modulation of neutrophil granulocytes in the tumor microenvironment: mechanisms and consequences for tumor progression. Semin Cancer Biol. 2013;23(3):141–148. doi:10.1016/j.semcancer.2013.02.005
29. Deryugina EI, Zajac E, Juncker-Jensen A, Kupriyanova TA, Welter L, Quigley JP. Tissue-infiltrating neutrophils constitute the major in vivo source of angiogenesis-inducing MMP-9 in the tumor microenvironment. Neoplasia. 2014;16(10):771–788. doi:10.1016/j.neo.2014.08.013
30. Riesenberg BP, Ansa-Addo EA, Gutierrez J, Timmers CD, Liu B, Li Z. Cutting edge: targeting thrombocytes to rewire anticancer immunity in the tumor microenvironment and potentiate efficacy of PD-1 blockade. J Immunol. 2019;203(5):1105–1110. doi:10.4049/jimmunol.1900594
31. Schlesinger M. Role of platelets and platelet receptors in cancer metastasis. J Hematol Oncol. 2018;11(1):125. doi:10.1186/s13045-018-0669-2
32. Galli F, Aguilera JV, Palermo B, Markovic SN, Nisticò P, Signore A. Relevance of immune cell and tumor microenvironment imaging in the new era of immunotherapy. J Exp Clin Cancer Res. 2020;39(1):89. doi:10.1186/s13046-020-01586-y
33. Jeong J, Suh Y, Jung K. Context drives diversification of monocytes and neutrophils in orchestrating the tumor microenvironment. Front Immunol. 2019;10:1817. doi:10.3389/fimmu.2019.01817
34. Lo YT, Lim VY, Ng M, et al. A prognostic model using post-steroid neutrophil-lymphocyte ratio predicts overall survival in primary central nervous system lymphoma. Cancers. 2022;14(7):1818. doi:10.3390/cancers14071818
35. Luo Q, Yang C, Fu C, Wu W, Wei Y, Zou L. Prognostic role of blood markers in primary central nervous system lymphoma patients treated with high-dose methotrexate-based therapy. Front Oncol. 2021;11:639644. doi:10.3389/fonc.2021.639644
36. Feng Y, Liu Y, Zhong M, Wang L. Complete blood count score model predicts inferior prognosis in primary central nervous system lymphoma. Front Oncol. 2021;11:1.
37. Li S, Xia Z, Cao J, et al. Proposed new prognostic model using the systemic immune-inflammation index for primary central nervous system lymphoma: a prospective-retrospective multicohort analysis. Front Immunol. 2022;13:1.
38. Feng J, Wang L, Yang X, Chen Q, Cheng X. Clinical utility of preoperative pan-immune-inflammation value (PIV) for prognostication in patients with esophageal squamous cell carcinoma. Int Immunopharm. 2023;123:110805. doi:10.1016/j.intimp.2023.110805
39. Fuca G, Beninato T, Bini M, et al. The pan-immune-inflammation value in patients with metastatic melanoma receiving first-line therapy. Target Oncol. 2021;16(4):529–536. doi:10.1007/s11523-021-00819-0
40. Yekedüz E, Tural D, Ertürk İ, et al. The relationship between pan-immune-inflammation value and survival outcomes in patients with metastatic renal cell carcinoma treated with nivolumab in the second line and beyond: a Turkish oncology group kidney cancer consortium (TKCC) study. J Cancer Res Clin Oncol. 2022;148(12):3537–3546. doi:10.1007/s00432-022-04055-5
41. Yang X-C, Liu H, Liu D-C, Tong C, Liang X-W, Chen R-H. Prognostic value of pan-immune-inflammation value in colorectal cancer patients: a systematic review and meta-analysis. Front Oncol. 2022;12:1036890. doi:10.3389/fonc.2022.1036890
42. Chen X, Hong X, Chen G, et al. The Pan-Immune-Inflammation Value predicts the survival of patients with anaplastic lymphoma kinase-positive non-small cell lung cancer treated with first-line ALK inhibitor. Transl Oncol. 2022;17:101338. doi:10.1016/j.tranon.2021.101338
43. Şahin AB, Cubukcu E, Ocak B, et al. Low pan-immune-inflammation-value predicts better chemotherapy response and survival in breast cancer patients treated with neoadjuvant chemotherapy. Sci Rep. 2021;11(1):14662. doi:10.1038/s41598-021-94184-7
44. Karadağ I, Karakaya S, Yılmaz ME, Çakmak Öksüzoğlu ÖB. The potential prognostic novel markers PIV and PILE score to predict survival outcomes at hepatocellular cancer. Eur Rev Med Pharm Sci. 2022;26(20):7679–7686. doi:10.26355/eurrev_202210_30044
45. Jang JE, Kim YR, Kim SJ, et al. A new prognostic model using absolute lymphocyte count in patients with primary central nervous system lymphoma. Eur J Cancer. 2016;57:127–135. doi:10.1016/j.ejca.2016.01.016
46. Liu C-J, Lin S-Y, Yang C-F, et al. A new prognostic score for disease progression and mortality in patients with newly diagnosed primary CNS lymphoma. Cancer Med. 2020;9(6):2134–2145. doi:10.1002/cam4.2872
47. Ferreri AJM, Blay J-Y, Reni M, et al. Prognostic scoring system for primary CNS lymphomas: the international extranodal lymphoma study group experience. J Clin Oncol. 2003;21(2):266–272. doi:10.1200/JCO.2003.09.139
48. Bessell EM, Graus F, Lopez-Guillermo A, et al. Primary non-Hodgkin’s lymphoma of the CNS treated with CHOD/BVAM or BVAM chemotherapy before radiotherapy: long-term survival and prognostic factors. Int J Radiat Oncol Biol Phys. 2004;59(2):501–508. doi:10.1016/j.ijrobp.2003.11.001
 © 2024 The Author(s). This work is published and licensed by Dove Medical Press Limited. The
full terms of this license are available at https://www.dovepress.com/terms.php
and incorporate the Creative Commons Attribution
- Non Commercial (unported, v3.0) License.
By accessing the work you hereby accept the Terms. Non-commercial uses of the work are permitted
without any further permission from Dove Medical Press Limited, provided the work is properly
attributed. For permission for commercial use of this work, please see paragraphs 4.2 and 5 of our Terms.
© 2024 The Author(s). This work is published and licensed by Dove Medical Press Limited. The
full terms of this license are available at https://www.dovepress.com/terms.php
and incorporate the Creative Commons Attribution
- Non Commercial (unported, v3.0) License.
By accessing the work you hereby accept the Terms. Non-commercial uses of the work are permitted
without any further permission from Dove Medical Press Limited, provided the work is properly
attributed. For permission for commercial use of this work, please see paragraphs 4.2 and 5 of our Terms.