")
Back to Journals » Risk Management and Healthcare Policy » Volume 17
The Non-Targeted Lipidomic-Based Classifier Reveals Two Candidate Biomarkers for Ischemic Stroke in Hypertensive Individuals
Authors Wang W, Liu L, Qiu W, Chen C , Huang Y, Cai A , Nie Z, Ou Y, Zhu Y, Feng Y
Received 21 February 2024
Accepted for publication 11 July 2024
Published 30 July 2024 Volume 2024:17 Pages 1889—1901
DOI https://doi.org/10.2147/RMHP.S465135
Checked for plagiarism Yes
Review by Single anonymous peer review
Peer reviewer comments 2
Editor who approved publication: Dr Gulsum Kubra Kaya
Wenbin Wang,1 Lin Liu,2 Weida Qiu,1 Chaolei Chen,1 Yuqing Huang,1 Anping Cai,1 Zhiqiang Nie,1 Yanqiu Ou,1 Yicheng Zhu,1 Yingqing Feng1
1Department of Cardiology, Hypertension Research Laboratory, Guangdong Cardiovascular Institute, Guangdong Provincial People’s Hospital, Guangdong Academy of Medical Sciences, Southern Medical University, Guangzhou, People’s Republic of China; 2Department of Medicine, The University of Hong Kong, Hong Kong, China
Correspondence: Yingqing Feng; Yicheng Zhu, Department of Cardiology, Hypertension Research Laboratory, Guangdong Cardiovascular Institute, Guangdong Provincial People’s Hospital, Guangdong Academy of Medical Sciences, Southern Medical University, No. 106, Zhongshan 2nd Road, Yuexiu District, Guangzhou, 510080, People’s Republic of China, Email [email protected]; [email protected]
Introduction: Traditional clinical risk factors are insufficient to estimate the residual risk of large-vessel ischemic stroke. Non-targeted lipidomic techniques provide an opportunity to evaluate these risks.
Methods: Plasma samples were collected from 113 hypertensive individuals, including 55 individuals at high risk of ischemic stroke and 58 matched individuals, in a prospective nested case-control cohort. To identify dysregulated lipid metabolites, we conducted multivariate and univariate analyses. A classifier based on a cross-validated procedure was employed to select the optimal combination of lipid species and their ratios.
Results: We identified 23 dysregulated lipid species in patients with and without ischemic stroke, including 16 (69.6%) up-regulated and 7 (30.4%) down-regulated lipid species. Through internal cross-validation, the optimal combination of two lipid features (phosphatidylcholine 34:2 and triglyceride 18:1/18:1/22:1 / phosphatidylcholine 34:2, referred to as ischemic stroke-related 2 lipid features - IS2LP) was selected, leading to a more precise prediction probability for ischemic stroke within 3.9 years. In the comparison of different risk factors, the traditional risk score, the IS2LP risk score, and the combination of the traditional risk score with IS2LP yield AUC values of 0.613(95% CI:0.509– 0.717), 0.833(95% CI:0.755– 0.911), and 0.843(95% CI:0.777– 0.916), respectively. The combination of the traditional risk score and IS2LP exhibited significantly improved discriminative performance, with an integrated discrimination improvement (IDI) of 0.31 (p< 0.001) and a continuous net reclassification improvement (NRI) of 1.06 (p < 0.001) compared to the traditional risk score.
Conclusion: We identified new lipidomic biomarkers associated with the futural event of large-vessel ischemic stroke. These lipid species could serve as potential blood biomarkers for assessing the residual risk of ischemic stroke in hypertensive individuals.
Keywords: hypertension, lipidomics, ischemic stroke, risk factors
Introduction
Ischemic stroke, with an incident rate of 94.51 per 100,000 person-years, is one of the leading causes of death and disability around the world and hypertension is the leading risk factor for it.1 To effectively utilize limited health resources to prevent stroke, new approaches to assessing the risk of stroke in the hypertensive population are required. Current widely used risk assessment tools, notably Framingham Stroke Profiles (FSP) and their revised version, face limitations, and potential bias, particularly when applied across diverse race/ethnic groups.2–4 Furthermore, the complexity and heterogeneity of stroke subtypes challenge the accuracy of these tools based on traditional risk factors alone in hypertensive individuals.5 This necessitates the exploration of novel approaches to better understand the specific mechanisms underlying ischemic stroke and to identify precise risk predictors tailored for hypertensive populations.
Previous studies have predominately focused on traditional lipid markers, such as low-density lipoprotein cholesterol (LDL-C), hypertension, and diabetes, to evaluate the risk of ischemic stroke in hypertensive individuals. Notably, despite appropriate statin treatment, residual cardiovascular risk persists, suggesting the presence of additional lipid risk factors beyond LDL-C.6 Advancements in lipidomics technologies present a unique opportunity to comprehensively explore the lipid landscape7 and its association with cardiovascular risk on a broader scale, taking into account the distinct pathogenetic mechanisms underlying ischemic stroke subtypes in hypertensive individuals.
While several studies have linked specific plasma lipid species to hypertension and cardiovascular risk,8–13 there remain limited studies focusing on ischemic stroke in hypertensive individuals using lipidomics technologies. Therefore, this study aims to identify candidate plasma lipid biomarkers associated with the futural events of large-vessel ischemic stroke in hypertensive populations through comprehensive lipidomics research. We hypothesized that specific plasma lipid species are closely linked to the risk of large-vessel ischemic stroke in hypertensive individuals, beyond the conventional risk factors, and may hold potential as novel biomarkers for precise risk prediction and targeted interventions in this high-risk population.
Materials and Methods
Study Population and Sample Selected
Individuals were recruited from a prospective hypertensive cohort in the Liaobu community, Dongguan Province, China. The research flow chart is shown in Figure 1. We included eligible participants without any stroke at baseline from January 2012 to December 2013, and follow-up data were collected until December 2017. A total of 116 participants suffered from large-vessel ischemic stroke. Among these participants, blood samples were collected from 71 cases at baseline. Propensity score matching was conducted using a 1:1 ratio, considering factors as follows: age, sex, systolic blood pressure (SBP), antihypertensive medication in the last 2 weeks, level of LDL-c, history of type 2 diabetes (T2DM), and atrial fibrillation. 58 incident cases of ischemic stroke that had sufficient stored plasma samples at baseline were selected. A group of 58 subjects who remained free from an ischemic stroke during the follow-up period were matched as controls. Ultimately, 3 unqualified plasma samples from the case group were excluded and a total of 113 plasma samples were included. Furthermore, the baseline characteristics description of the cases that conducted lipidomic profiling (55 participants) and those participants who did not conduct lipidomic profiling (61 participants) indicated minimal selection bias in case selection for this study (Table S1). This project complied with the Helsinki Declaration, and the study protocol and informed consent procedures were approved by the institutional medical ethics committee of Guangdong Provincial People’s Hospital (KY-Q-2021-210-01). All participants signed an informed consent form and voluntarily agreed to participate.
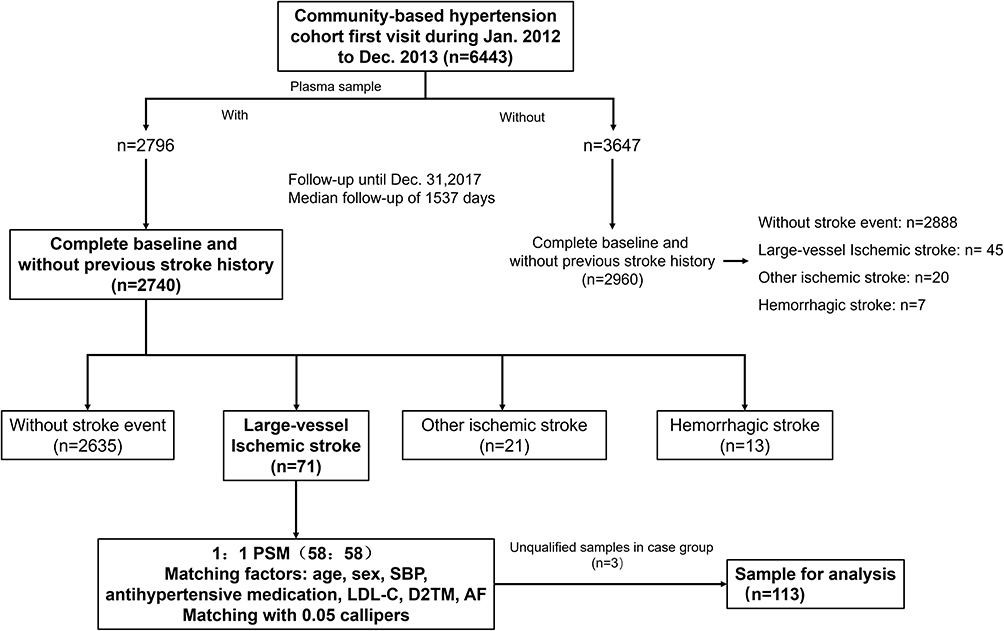 |
Figure 1 Flow of sample selection in this nested case-control study. Abbreviations: PSM, Propensity score matching; SBP, Systolic blood pressure; LDL-C, low-density lipoprotein cholesterol; D2TM, Type 2 Diabetes Mellitus; AF, Atrial fibrillation. |
Data Collection and Definition
Demographic data, including age, sex, smoking status, blood pressure, height, weight, body mass index, history of disease, and current medications, were collected from each participant using a standardized approach at both baseline and annual follow-up assessments. Blood samples were obtained from participants following a minimum fasting period of 8 hours. The extracted plasma samples used for lipidomics analysis were immediately stored at −80°C until required. The outcome of this study was defined as the occurrence of new-onset large-vessel ischemic stroke. The clinical outcome was ascertained by both local medical records of hospitalization and local medical examinations. Ischemic stroke was diagnosed based on cranial CT or MRI scans with evidence of obstruction or stenosis of brain-supplying vessels. Left ventricular hypertrophy was determined based on electrocardiography findings. For each participant included in this study, we assessed 10-year Framingham Stroke Profiles. The total sum of these scores was then used to stratify individuals into different risk categories, as follows: low risk: 1–9 points in women and 1–10 points in men, intermediate risk: 10–18 points in women and 11–20 points for men, high risk 19–27 points in women and 21–30 points in men.
Lipid Extraction
The plasma samples were initially thawed at a temperature of 4°C. Once thawed, 100μL of plasma was added to a 96-well plate for analysis. To this, 300μL of pre-cooled isopropanol (at −20°C) and 10μL of SPLASH were thoroughly mixed for 1 minute. Subsequently, the mixture was centrifuged at a rotation speed of 4000 rpm for 20 minutes, following an overnight storage at −20°C. The supernatant liquid obtained after centrifugation was transferred to sample vials for LC-MS analysis. To evaluate the stability of the LC-MS analysis, pooled samples for quality control (QC) were prepared by combining 10μL of each sample.
Lipid Analysis Condition
The lipid analysis was performed using Waters 2D ultra-performance liquid chromatography (UPLC) (waters, USA) tandem Q Exactive high-resolution mass spectrometer (Thermo Fisher Scientific, USA).
Chromatography Conditions
The chromatographic separation was conducted using a CSH C18 column (1.7 μm 2.1*100mm, Waters, USA). In the positive ion mode, mobile-phase A consisted of 60% acetonitrile (can) in water with 10 mM ammonium formate and 0.1% formic acid. Mobile-phase B consisted of 10% ACN in 90% isopropanol (IPA) with 10mM ammonium formate and 0.1% formic acid. In negative ion mode, liquid A comprised 60% ACN with 10 mM ammonium formate, while liquid B contained 10% ACN in 90% IPA with 10 mM ammonium formate. The gradient elution applied during the analysis was as follows: 0–2 min, 40%-43% B; 2–2.1 min, 43%-50% B; 2.1–7 min, 50%-54% B; 7–7.1 min, 54%-70% B; 7.1–13 min, 70%-99% B; 13–13.1 min, 99%-40% B; and 13.1–15 min, 40% B. The flow rate was set at 0.35 mL/min. The column temperature was maintained at 55°C, and the injection volume for each sample was 5 μL.
Mass Spectrometry Conditions
The mass spectrometry data was collected using a Thermo Fisher Scientific Q Exactive mass spectrometer. Primary and secondary mass spectrometry scans were obtained. The primary MS scan was acquired at a resolution of 70,000 with an Automatic Gain Control (AGC) target value of 3×10⁶. The scan range was set from 200 to 2000 m/z, with a maximum Ion Trap (IT) of 100 ms. For fragmentation analysis, the three most intense parent ions were selected, and secondary MS spectra were recorded. The secondary MS spectra were obtained at a resolution of 17,500, with an AGC target value of 1×10⁶ and a maximum IT of 50 ms. A stepped normalized collision energy of 13, 30, and 45 eV was applied. The electrospray ionization (ESI) parameters were set as follows: the sheath gas flow was maintained at 40 arbitrary units, the auxiliary gas flow at 10 arbitrary units, the spray voltage in positive mode at 3.80 kV, and the spray voltage in negative mode at 3.20 kV. Additionally, the capillary temperature was set to 320°C, and the auxiliary gas heater temperature was set to 350°C.
To minimize systemic errors, the samples were processed in a randomized order and one quality control (QC) sample was run every 10 samples.
Data Processing
LipidSearch software (v.4.1, Thermo Fisher Scientific, USA) was used for peak identification, peak extraction, and lipid search. The main parameters used were: a precursor tolerance of 5 ppm; a product tolerance of 5 ppm; and a product ion threshold of 5%. The resulting matrix was exported and further processed using metaX software.14 We removed the lipids that had missing values exceeding 50% in quality control samples and missing values exceeding 20% in experiment samples. The missing values were filled using the K-Nearest Neighbor algorithm (KNN). The probabilistic quotient normalization (PQN) algorithm was employed to normalize the data.15 To avoid batch effects, a quality control-based robust LOESS signal correction algorithm was implemented.16 Finally, lipids were discarded if their coefficient of variation (CV) was greater than 30% in all quality control samples.
Statistical Analysis
Before data analysis, the final lipid data was transformed to the log2 scale to facilitate the subsequent analyses, except for correlation analysis. The SIMCA 14.1 software (Umea, Sweden) was used for principal component analysis (PCA), and partial least-squares discriminant analysis (PLS-DA) with Pareto scaling was used. For other statistical procedures, we employed R (version 4.2.2) and relevant R packages. To identify dysregulated lipid species, fold change and Welch’s t-test (p<0.05) were performed. ROC curves were conducted to evaluate the diagnostic efficacy of candidate lipid biomarkers (Package “pROC”, version 1.18.4). Furthermore, we assess the correlation between dysregulated lipids species and traditional risk factors through Pearson correlation coefficient analysis. To identify more discriminative markers, we calculated the ratios of upregulated biomarkers to downregulated biomarkers in TG and PC species.
To predict the risk for ischemic stroke in individuals with hypertension, we followed a series of steps. Firstly, the minimum redundancy maximum relevance algorithm17 (Packages “mRMRe”, version 2.1.2.1) was employed to sort the importance of features, and the top 10 most related features were selected for downstream analyses. Secondly, the patients were divided into a training set and a testing set at a ratio of 3:1. Within the training set, the top 10 optimal features were fitted into a logistic regression model between stroke patients and the control, and the performance of the classifier was evaluated by AUC of ROC. The most discriminative feature was selected as the first classifier. Most of the discriminative features were repeatedly added while increasing AUC values. In each fourfold cross-validation, the features selected at least twice in the training set were chosen as the combination features for the best model. To assess the reproducibility of classification, the described procedures were repeated 500 times.18 To compare the discrimination of traditional risk factors and lipid features, the most frequently selected combination of lipid features was selected as the optimal model. We fitted a model using FSP risk factors, including age, sex, SBP, antihypertensive medication in the last 2 weeks, T2DM, smoking, cardiovascular disease, and left ventricular hypertrophy. The model calibrations were evaluated using the Hosmer-Lemeshow test. Patient discrimination and reclassification were assessed using AUC values, integrated discrimination improvement (IDI), and continuous net reclassification improvement (NRI).
Continuous variables were summarized as mean and standard deviation (SD) if they were normally distributed, or summarized as median and interquartile range if they were non-normally distributed, and the categorical variables were shown as frequency and percentage. T-test, Kruskal–Wallis rank sum test, or chi-square test was used for comparisons. The statistically significant threshold was set at p-value < 0.05 for clinical data.
Results
Baseline Characteristics
The study included a total of 113 hypertensive participants, including 55 individuals with ischemic stroke and 58 individuals without ischemic stroke during follow-up. The median follow-up time for these participants was 3.9 years. None of the participants had atrial fibrillation. The analysis revealed that the group with ischemic stroke had lower levels of HDL-C (high-density lipoprotein cholesterol) and higher diastolic blood pressure (DBP). No statistically significant differences were found in the baseline clinical variables, including age, sex, smoking, diabetes mellitus, left ventricular hypertrophy, systolic blood pressure, body mass index, total cholesterol, triglycerides, low-density cholesterol, and 10-year FSP risk stratification (Table 1).
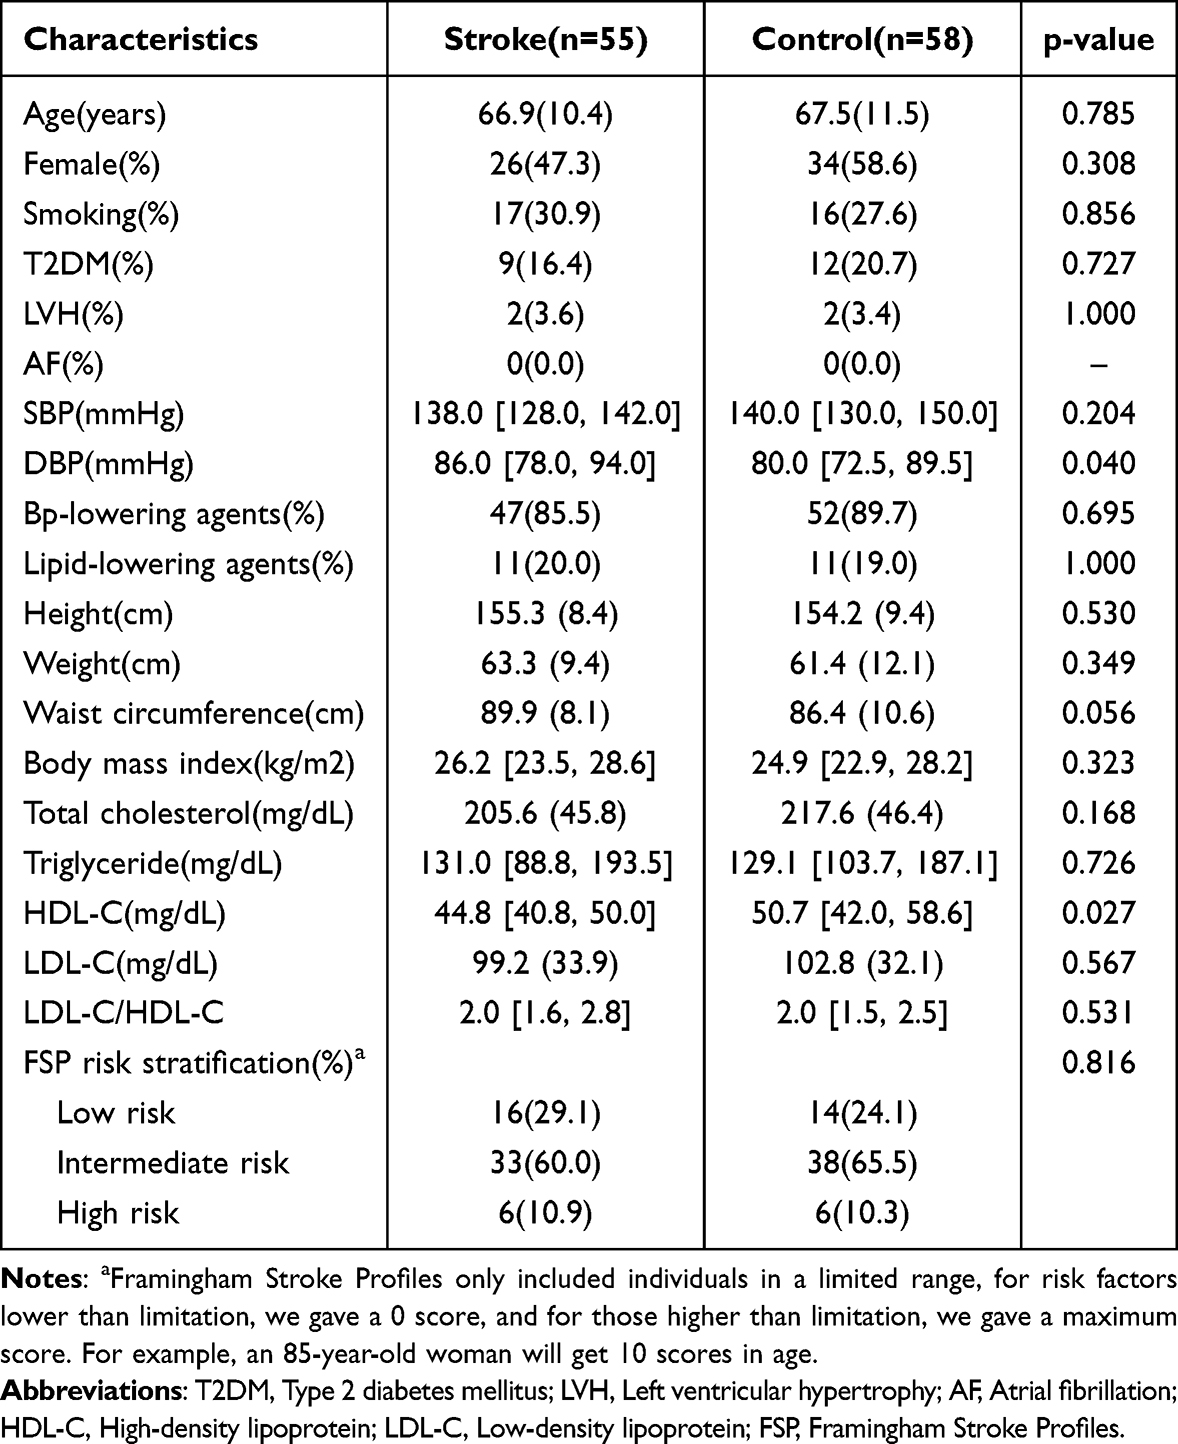 |
Table 1 Baseline Characteristics of Subjects Included in This Study |
Plasma Lipid Profiling Using LC-MS/MS
The lipid profiles of 113 individuals with hypertension were analyzed using the LC-MS/MS untargeted lipidomics platform. A total of 935 lipid species were detected in all participants. For downstream analysis, 877 lipid species (94% of the detected lipids) with a relative standard deviation lower than 0.3 were retained (Figure S1). These retained lipid species belonged to 39 different lipid subclasses, with phosphatidylcholine (PC) subclasses representing 35.5% of the lipid species (Figure S2).
Multivariate Statistical Analysis
To assess the overall metabolic impacts on the plasma of participants between the two groups, lipid metabolic alterations were first analyzed. The PCA score plot (Figure 2A) did not discriminate metabolic profiles between the two groups. However, the PLS-DA score plot (Figure 2B) indicated a distinction between the two groups, suggesting that some ischemic stroke-related lipid species were already changed in individuals with hypertension. In the permutation test (Figure 2C), the R2 (0.524) and Q2 (−0.196) on the left were lower than those on the right, indicating that the models were suitable for further analysis. We further selected twenty-three lipid species as potential biomarkers with (1) VIP >1, (2) p<0.05 and (3) fold change > 1.2 or fold change < 0.83 (Figure 3 and Table 2). Most of these potential biomarkers were in TG (56.5%) and PC (30.4%) subclasses. Correlation analysis between dysregulated lipids species and traditional risk factors was analyzed. For two traditional risk factors showing significant differences between groups, DBP was the most correlated with PC 42:9 (r=0.20, p=0.032) and HDL-C was the most correlated with TG 18:1/17:1/18:1 (r=−0.46, p<0.001). The results showed a limited correlation between dysregulated lipid species and traditional risk factors (Figure S3). We performed a clustering analysis (Figure S4) to describe the overall trend of potential biomarkers. The findings indicated that potential biomarkers mainly upregulated (69.6%) in patients with ischemic stroke, especially in TG.
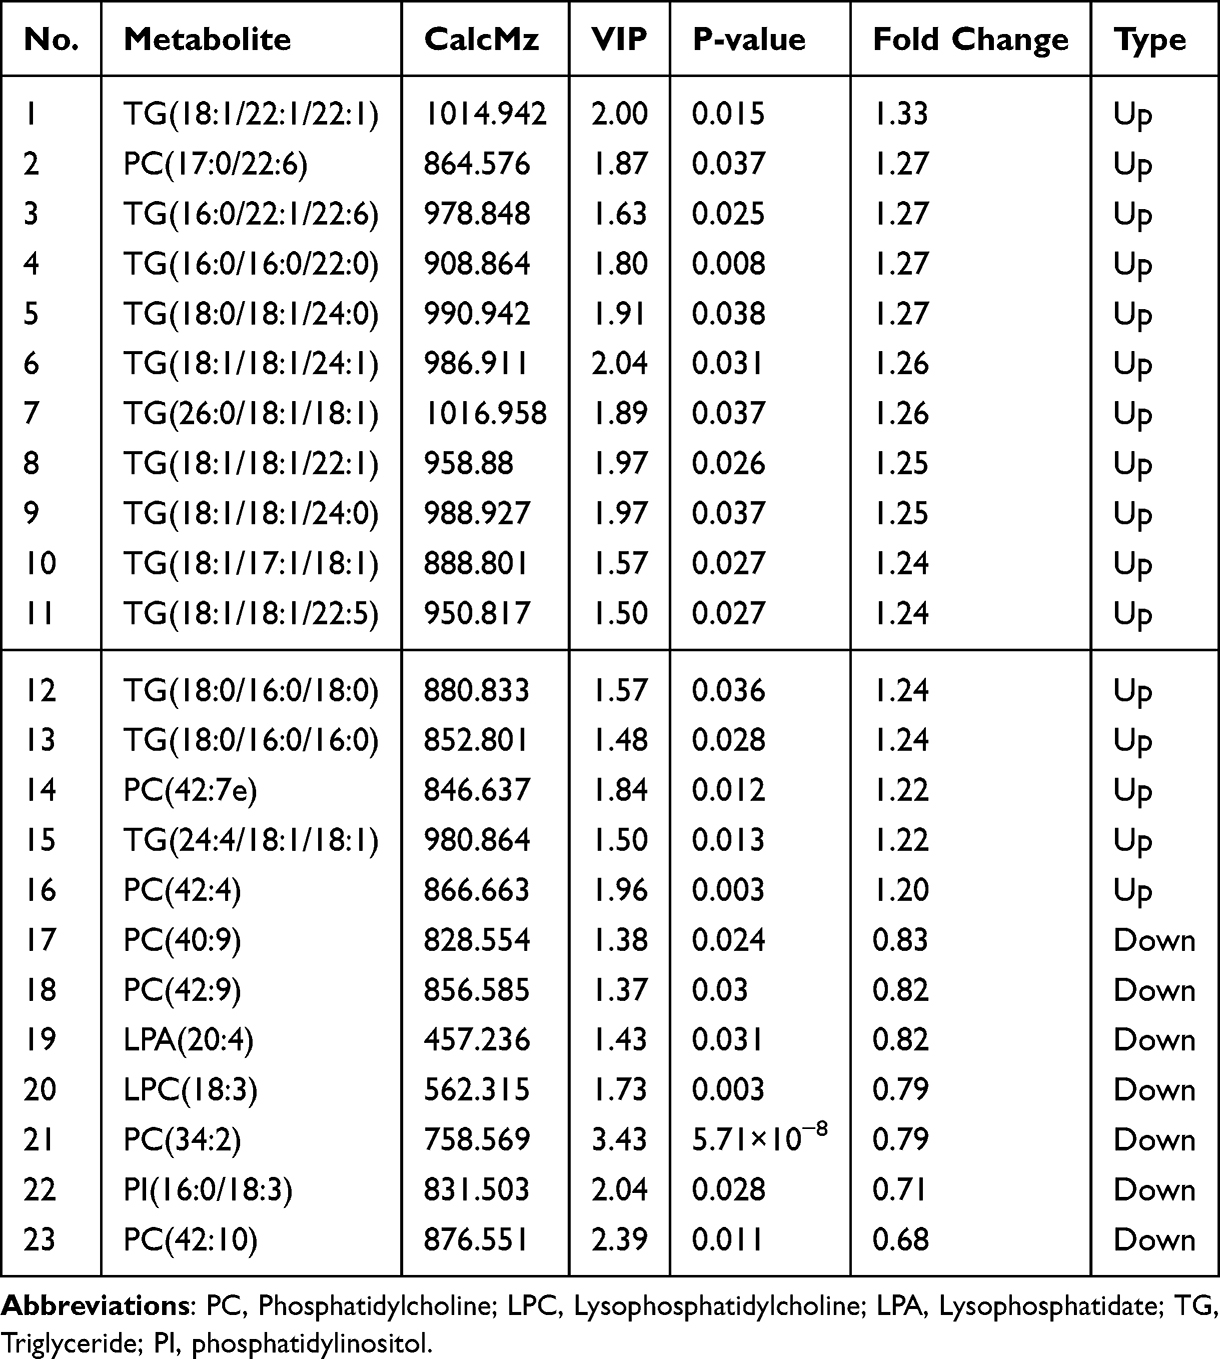 |
Table 2 Potential Plasma Biomarkers Associated with Ischemic Stroke |
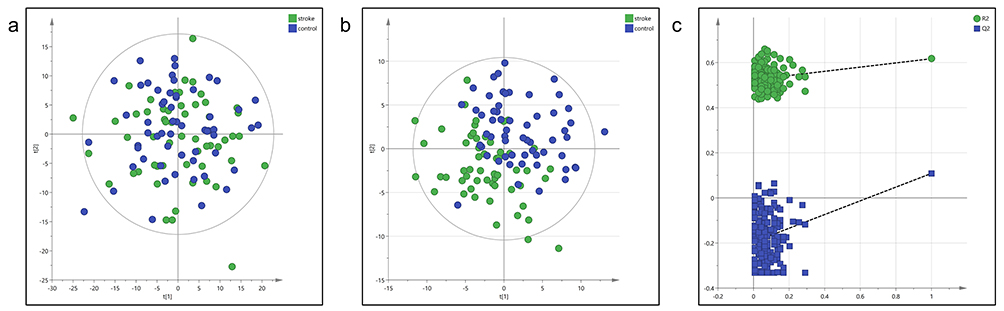 |
Figure 2 Multivariate statistical analysis of the lipidomic analysis. (a) Principal component analysis (PCA) Plot, (b) partial least-squares discriminant analysis (PLS-DA) plot, (c) permutation test (200 cycles) of the case and control group (Case =55, Control=58). |
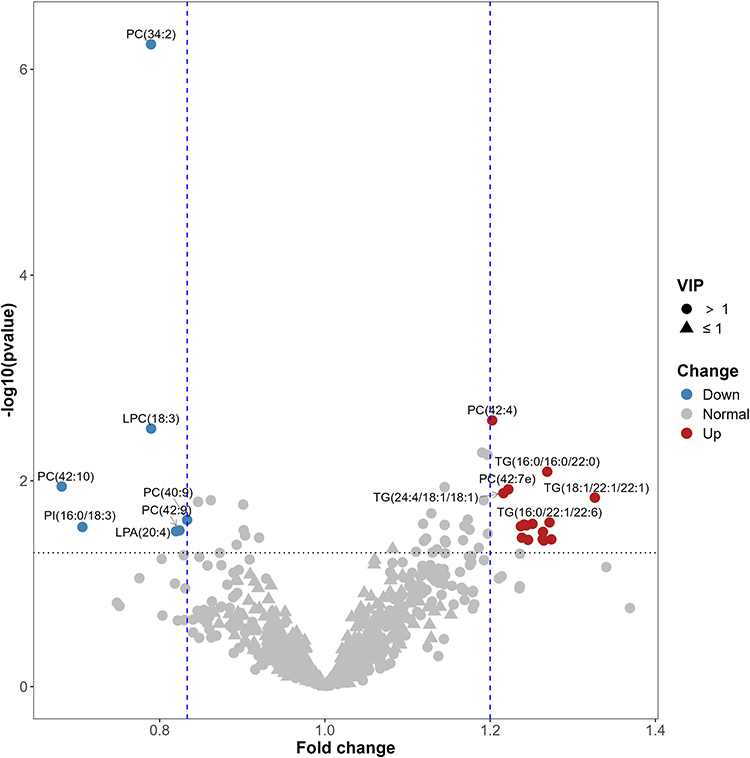 |
Figure 3 Potential biomarkers visualization analysis for predicting the risk of ischemic stroke. (potential biomarkers identified by all of the following sets: VIP > 1, Fold change (FC) > 1.2 or FC < 0.83, P<0.05. VIP indicates Variable Importance of the Projection). |
Screening for Potential Biomarkers
Considering most potential lipid species were in the TG and PC subclasses, significant TG and PC species were selected for further analysis. The ROC analysis (Figure 4) showed that the top 3 potential biomarkers with the highest AUC values were PC 34:2 (AUC = 0.784, 95% CI: 0.698–0.870), PC 42:4 (AUC = 0.666, 95% CI:0.565–0.767), LPC 18:3 (AUC = 0.661, 95% CI:0.560–0.762). To further explore lipid species biomarkers, we accessed the ratio of upregulated markers and downregulated markers. The top 3 ratios of lipid species were PC 42:4 / PC 34:2 (AUC = 0.771, 95% CI:0.682–0.859), TG 18:1/18:1/22:1 / PC 34:2 (AUC = 0.753, 95% CI:0.661–0.845) and TG 24:4/18:1/18:1 / PC 34:2 (AUC = 0.751, 95% CI:0.661–0.842).
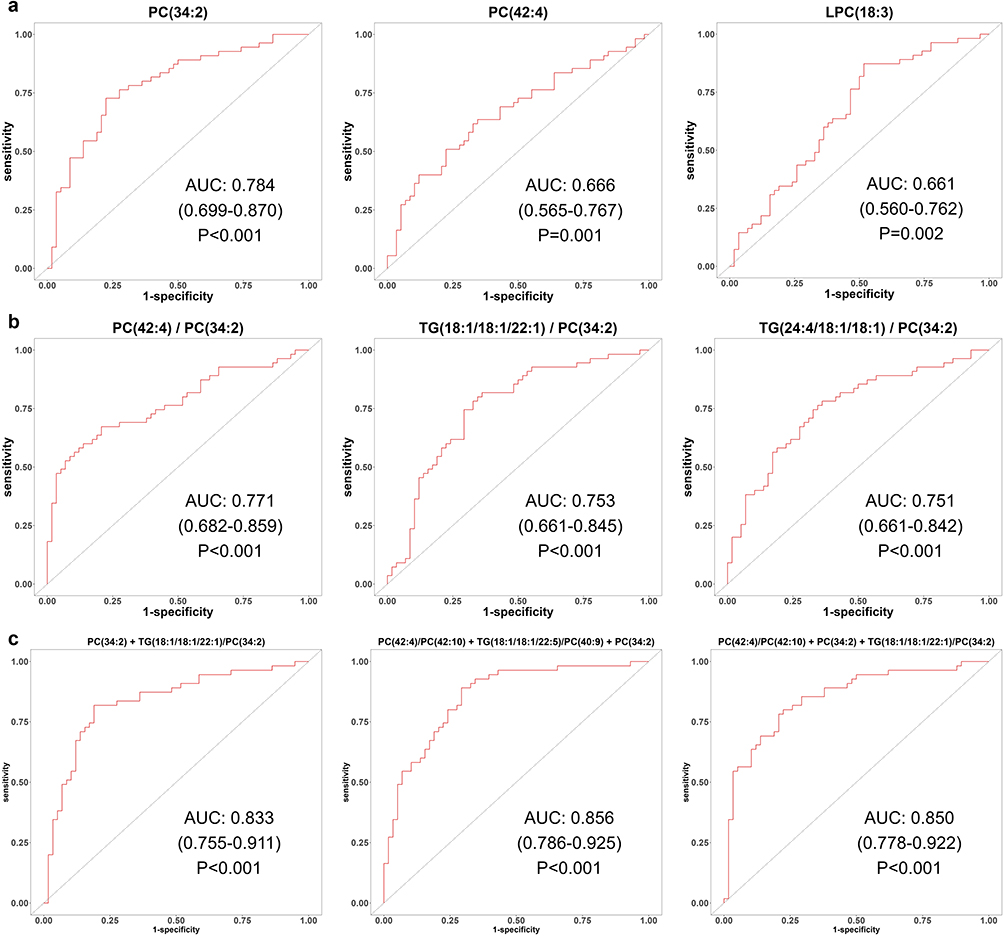 |
Figure 4 ROC analysis for top 3 lipid features in predicting the risk of ischemic stroke. (a) ROC analysis for top 3 lipid species, (b) ROC analysis for top 3 lipid ratios, (c) ROC analysis for top 3 lipid combinations (AUC and 95% confidence intervals are shown). |
To screen a combination of lipid features for classifying the risk of ischemic stroke in individuals with hypertension, we performed feature selection steps and cross-validation as described above. Finally, the top 3 most frequently selected combinations of lipid features were PC 34:2 + TG 18:1/18:1/22:1 / PC 34:2 (AUC = 0.833, 95% CI:0.755–0.911), PC 34:2 + PC 42:4/PC 42:10 + TG 18:1/18:1/22:55 / PC 40:9 (AUC = 0.856, 95% CI:0.786–0.925) and PC 34:2 + PC 42:4 / PC 42:10 + TG 18:1/18:1/22:1 / PC 34:2 (AUC = 0.850, 95% CI:0.778–0.922).
Comparison with Traditional Cardiovascular Risk Model
To verify the existence of residual risk and improvement of a risk prediction model based on the novel lipidic species, we selected the most frequently occurring combinations of lipid features, including PC 34:2 and TG 18:1/18:1/22:1 / PC 34:2 (Ischemic stroke related 2 lipid features-IS2LP), as the optimal model. Then we compared the IS2LP model with the traditional FSP model. The AUC of FSP and IS2LP is 0.613(95% CI:0.509–0.717) and 0.833(95% CI:0.755–0.911), respectively. Combining the FSP risk score with the new IS2LP risk score (FSP + IS2LP), an additional model was established. The FSP+IS2LP model significantly improved the AUC for predicting the risk of ischemic stroke compared with the FSP model alone (AUC 0.843, 95% CI: 0.777–0.916, p=3.6×10⁻¹⁰ vs FSP; Table 3 and Figure 5). Furthermore, the FSP+IS2LP model showed better discriminative performance, with an NRI of 1.06 (p < 0.001) and an IDI of 0.31 (p<0.001) (Table 3).
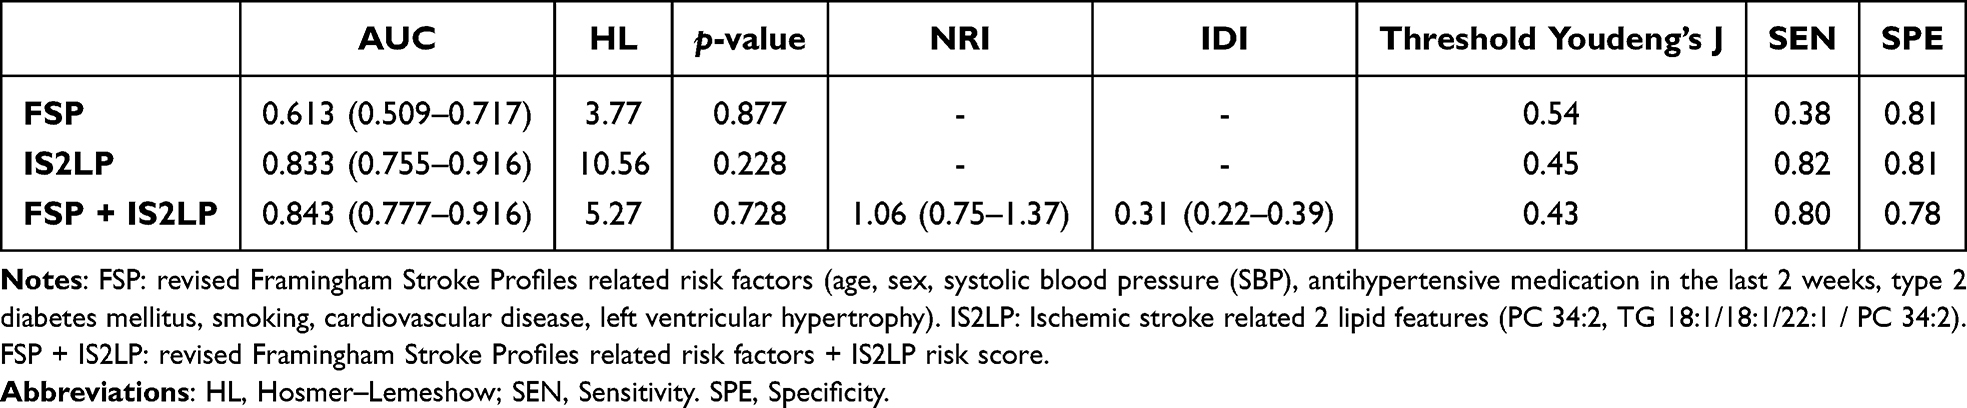 |
Table 3 Comparison of Model Performances for Predicting the Risk of Ischemic Stroke in Hypertension |
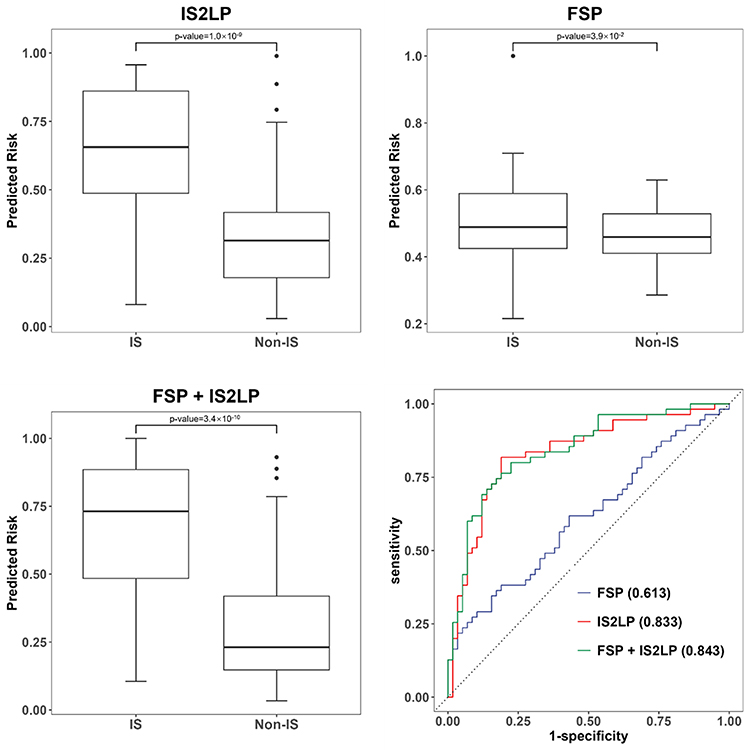 |
Figure 5 Improvement in discrimination for prediction of ischemic stroke risk with each model. (FSP: revised Framingham Stroke Profiles related risk factors (age, sex, systolic blood pressure, antihypertensive medication in the last 2 weeks, type 2 diabetes mellitus, smoking, cardiovascular disease, left ventricular hypertrophy). IS2LP: Ischemic stroke related 2 lipid features (PC 34:2, TG 18:1/18:1/22:1 / PC 34:2). FSP + IS2LP: revised Framingham Stroke Profiles related risk factors + IS2LP risk score. The Wilcoxon test was used for statistical assessment). Abbreviation: HL, Hosmer–Lemeshow. |
Discussion
In this prospective nested case-control study, we identified 23 dysregulated lipid species, including 16 up-regulated lipids and 7 down-regulated lipids, in individuals with ischemic stroke. These dysregulated lipid species predominantly belong to the TG (56.5%) and the PC (30.4%) subclasses. The correlation analysis showed a limited correlation between these biomarkers and traditional risk factors (Figure S3), suggesting that there may be distinct pathogenesis mechanisms in lipid metabolism for ischemic stroke.
We further develop the IS2LP risk score using two special lipid species to classify ischemic stroke in hypertensive individuals. We constructed a FSP risk score based on traditional risk factors as a base model. While adding the IS2LP risk score to the FSP model, the AUC values increase to 0.843(p=3.6×10⁻¹⁰). The NRI and IDI values both showed that the combination model performed better in risk stratification compared with the FSP model. These results suggested that lipidomic was promising in predicting the risk of ischemic stroke.
Triglycerides are important storage forms of energy, mainly in adipose tissue. An increased level of triglycerides is a signal of the accumulation of chylomicron and VLDL remnants,19 which may eventually contribute to atherosclerosis. Epidemiologic and genetic evidence has supported the finding that triglycerides were associated with the risk of atherosclerotic cardiovascular diseases, and the risk of atherosclerotic cardiovascular disease increases continuously with plasma triglycerides.20–26 However, whether triglycerides are proatherogenic lipids or just markers remains controversial.19,27 Previous studies have shown that a set of triglycerides rather than total triglycerides were risk predictors of cardiovascular diseases or related risk factors,28,29 suggesting that the relevance between triglycerides and ischemic stroke may be inaccurately estimated by using total triglycerides. Our study supports this idea, as we found that specific TG species (16.3% of total TG species) are associated with an increased risk of ischemic stroke. This finding underscores the importance of considering special TG species in assessing the risk of ischemic stroke, rather than solely relying on total triglyceride levels.
Phosphatidylcholines emerge as a secondary significant dysregulated lipid species in this study. The metabolism of phosphatidylcholine in humans is complex and previous observational studies have reported diverse associations between PC species and atherosclerotic disease.9,10,30–32 One perspective argues that increased phosphatidylcholine levels facilitate the secretion of triacylglycerol-rich lipoproteins from the liver, potentially contributing to atherosclerosis.33 In contrast, another viewpoint suggests that phosphatidylcholine, with its content of polyunsaturated fatty acids (PUFAs), is a protective factor for atherosclerotic disease.34 Furthermore, the results of clinical trials examining PUFAs supplementation in preventing cardiovascular events have been inconsistent. For instance, while a high dose of icosapent ethyl demonstrated a reduction in cardiovascular events in the REDUCE-IT study, the VITAL study found no significant impact on major cardiovascular events with n-3 fatty acid supplementation.35,36 These mixed results suggested specific lipid species should be focused on when exploring the association between phosphatidylcholines and cardiovascular diseases. The role of phosphatidylcholine in the pathogenesis of ischemic stroke remains unclear. In our study, we observed up-regulated and down-regulated PC species in the case group, indicating potential differences in the pathogenic mechanisms of phosphatidylcholines. Notably, an animal study also demonstrated that certain phosphatidylcholine species, including PC 34:2, decreased in the ischemic brain parenchyma of rats,37 suggesting that PC 34:2 might possess protective properties against cerebral ischemia. Consistent with these findings, our study reveals a significant down-regulation of PC 34:2 in individuals at high risk of ischemic stroke. These results highlight the potential importance of PC 34:2 and other specific phosphatidylcholine species as potential protective factors in the context of cerebral ischemia.
To identify biomarkers for better discriminating the patients with a high risk of ischemic stroke from the control, ROC analysis of significant biomarkers was performed. We found that a single lipid species was insufficient for assessing the futural risk of ischemic stroke and the combination of lipid features significantly improved the predictive power (Figure 4). The combination of two lipid features (PC 34:2 and TG 18:1/18:1/22:1 / PC 34:2) could be considered the optimal panel because the panel had been most frequently selected. Compared with previous studies using lipidomics to predict cardiovascular risk, whose AUC values range from 0.67 to 0.81,13 the combination of our lipid features provided acceptable diagnostic accuracy. These results suggest that the two lipid species have priority as candidate biomarkers for the future event of ischemic stroke.
A recent study shows that a set of ceramides are associated with cardiovascular diseases.38 The ceramide risk scores, comprising three ceramide and three ceramide ratios, outperform traditional lipid markers in stratifying risk.39 The ceramide panel has already been implemented at the Mayo Clinic.40 Unfortunately, we did not observe any association between ceramide species and ischemic stroke in our study. Nevertheless, the emergence of ceramides as predictors of cardiovascular disease risk underscores the importance of utilizing specific lipid species, rather than broad lipid classes, for more accurate risk prediction.41,42 In our investigation, we identified TG 18:1/18:1/22:1 and PC 34:2 that significantly enhanced the predictive power for risk stratification of ischemic stroke. In clinical practice, residual risks of ischemic stroke always exist, and there is great value in new biomarkers in accurately identifying the exceeded risk of patients based on current risk factors. As indicated by the data presented in Table 1, the 10-year stroke risk stratification computed using Framingham Stroke Profiles was comparable between the two groups. However, our risk scores based on lipid species successfully divided the individuals into distinct risk groups (Figure 5). This suggests that the combination of TG 18:1/18:1/22:1 and PC 34:2 holds the potential for identifying residual risks for ischemic stroke in hypertensive populations, offering valuable insights for further exploration in this field.
Our study does have a few limitations that should be taken into account. Firstly, we did not conduct targeted lipidomic analysis to validate our findings. However, AUC values obtained from different combinations of lipid species were consistently higher than those of traditional risk scores in our internal cross-validation procedure. Secondly, the sample sizes were not calculated before the study, which might limit the generalization of our results. Thirdly, the median follow-up time was only 3.9 years, which restricts the predictive ability of our lipid risk scores to a relatively narrow time frame. Fourthly, we admitted that selection bias might exist in this nested case-control study for the difference between the general population and the selected population. However, only the proportion of participants using blood-pressure-lowering agents at baseline significant different between individuals suffering from large-vessel ischemic who were selected to conducting lipidomic profiling and those who were not selected (Table S1), which suggested the selection bias in this study is acceptable Except for selection bias in internal data, all participants in this study are the Asian origin, which might limit the generalizability of these results to other ethnicities. These biomarkers should be further validated in a general population with hypertension before being translated to the clinic. Fifthly, a previous study suggested that suboptimal use of statins contributed to worse clinical outcomes in stroke individuals,43 which might be an important factor affecting lipid metabolism. In our study, we can not assess medication adherence which might cause some bias in our results. Nevertheless, we must note that only about 20% of individuals take lipid-lowering drugs and this percentage is not different from the lipid-lowering agents used among the two groups in our study.
Conclusion
We identified several lipid biomarkers that could be used to predict the risk of large-vessel ischemic stroke in hypertensive patients. In addition, the combination of especially TG 18:1/18:1/22:1 and PC 34:2 appears to be particularly promising as a candidate biomarker for futural ischemic stroke events. These results are needed to be validated in a larger sample involving different regions and races participants in the future.
Abbreviations
AUC, Area under the curve; ROC, Receiver operating characteristic; CI, Confidence interval; LDL-C, Low-density lipoprotein cholesterol; SBP, Systolic blood pressure; DBP, Diastolic blood pressure; T2DM, Type 2 diabetes; LC-MS/MS, Liquid chromatography-tandem mass spectrometry; UPLC, Ultra-performance liquid chromatography; CAN, Acetonitrile; IPA, Isopropanol; AGC, Automatic Gain Control; IT, Ion Trap; ESI, Electrospray ionization; QC, quality control; KNN, K-Nearest Neighbor algorithm; PQN, Probabilistic quotient normalization; LOESS, Locally Weighted Regression; PCA, principal component analysis; PLS-DA, partial least-squares discriminant analysis; IDI, Integrated discrimination improvement; NRI, Net reclassification improvement; FSP, Framingham stroke profiles; IS2LP, Ischemic stroke related 2 lipid species; TG, Triglyceride; PC, Phosphatidylcholine; VIP, Variable Importance of the Projection.
Data Sharing Statement
The data presented in this study are available on request from the corresponding author.
Acknowledgments
We appreciate Shenzhen BGI Co., Ltd. for LC-MS/MS analysis, data processing, and excellent technical assistance.
Funding
This research was funded by the Key Area R&D Program of Guangdong Province (No. 2019B020227005), and the Guangdong Academy of Medical Sciences open subject fund project (YKY-KF202203).
Disclosure
Wenbin Wang reports statistical analysis during the data preparation stage is provided by Shenzhen BGI Co., Ltd. The authors report no other conflicts of interest in this work.
References
1. Forouzanfar MH, Afshin A, Alexander LT, et al. Global, regional, and national comparative risk assessment of 79 behavioural, environmental and occupational, and metabolic risks or clusters of risks, 1990–2015: a systematic analysis for the Global Burden of Disease Study 2015. Lancet. 2016;388(10053):1659–1724. doi:10.1016/S0140-6736(16)31679-8
2. Wolf PA, D’Agostino RB, Belanger AJ, Kannel WB. Probability of stroke: a risk profile from the Framingham Study. Stroke. 1991;22(3):312–318.
3. D’Agostino RB, Wolf PA, Belanger AJ, Kannel WB. Stroke risk profile: adjustment for antihypertensive medication. The Framingham study. Stroke. 1994;25(1):40–43.
4. Meschia JF, Bushnell C, Boden-Albala B, et al. Guidelines for the primary prevention of stroke: a statement for healthcare professionals from the American Heart Association/American Stroke Association. Stroke. 2014;45(12):3754–3832. doi:10.1161/STR.0000000000000046
5. Adams HP, Bendixen BH, Kappelle LJ, et al. Classification of subtype of acute ischemic stroke. Definitions for use in a multicenter clinical trial. TOAST. Trial of Org 10172 in Acute Stroke Treatment. Stroke. 1993;24(1):35–41.
6. Matsuura Y, Kanter JE, Bornfeldt KE. Highlighting residual atherosclerotic cardiovascular disease risk. Arterioscler Thromb Vasc Biol. 2019;39(1):e1–e9. doi:10.1161/ATVBAHA.118.311999
7. Quehenberger O, Armando AM, Brown AH, et al. Lipidomics reveals a remarkable diversity of lipids in human plasma. J Lipid Res. 2010;51(11):3299–3305. doi:10.1194/jlr.M009449
8. Kulkarni H, Meikle PJ, Mamtani M, et al. Plasma lipidomic profile signature of hypertension in Mexican American families: specific role of diacylglycerols. Hypertension. 2013;62(3):621–626. doi:10.1161/HYPERTENSIONAHA.113.01396
9. Alshehry ZH, Mundra PA, Barlow CK, et al. Plasma lipidomic profiles improve on traditional risk factors for the prediction of cardiovascular events in type 2 diabetes mellitus. Circulation. 2016;134(21):1637–1650.
10. Razquin C, Liang L, Toledo E, et al. Plasma lipidome patterns associated with cardiovascular risk in the PREDIMED trial: a case-cohort study. Int J Cardiol. 2018;253:126–132. doi:10.1016/j.ijcard.2017.10.026
11. Yun H, Sun L, Wu Q, et al. Lipidomic signatures of dairy consumption and associated changes in blood pressure and other cardiovascular risk factors among Chinese adults. Hypertension. 2022;79(8):1617–1628. doi:10.1161/HYPERTENSIONAHA.122.18981
12. Chen M, Miao G, Zhang Y, et al. Longitudinal lipidomic profile of hypertension in American Indians: findings from the strong heart family study. Hypertension. 2023;80(8):1771–1783. doi:10.1161/HYPERTENSIONAHA.123.21144
13. Nurmohamed NS, Kraaijenhof JM, Mayr M, et al. Proteomics and lipidomics in atherosclerotic cardiovascular disease risk prediction. Eur Heart J. 2023;44(18):1594–1607. doi:10.1093/eurheartj/ehad161
14. Wen B, Mei Z, Zeng C, Liu S. metaX: a flexible and comprehensive software for processing metabolomics data. BMC Bioinf. 2017;18(1):183. doi:10.1186/s12859-017-1579-y
15. Di Guida R, Engel J, Allwood JW, et al. Non-targeted UHPLC-MS metabolomic data processing methods: a comparative investigation of normalisation, missing value imputation, transformation and scaling. Metabolomics. 2016;12:93.
16. Dunn WB, Broadhurst D, Begley P, et al. Procedures for large-scale metabolic profiling of serum and plasma using gas chromatography and liquid chromatography coupled to mass spectrometry. Nat Protoc. 2011;6(7):1060–1083. doi:10.1038/nprot.2011.335
17. De Jay N, Papillon-Cavanagh S, Olsen C, El-Hachem N, Bontempi G, Haibe-Kains B. mRMRe: an R package for parallelized mRMR ensemble feature selection. Bioinformatics. 2013;29(18):2365–2368. doi:10.1093/bioinformatics/btt383
18. Borràs E, Cantó E, Choi M, et al. Protein-based classifier to predict conversion from clinically isolated syndrome to multiple sclerosis. Mol Cell Proteomics. 2016;15(1):318–328. doi:10.1074/mcp.M115.053256
19. Ginsberg HN, Packard CJ, Chapman MJ, et al. Triglyceride-rich lipoproteins and their remnants: metabolic insights, role in atherosclerotic cardiovascular disease, and emerging therapeutic strategies-a consensus statement from the European Atherosclerosis Society. Eur Heart J. 2021;42(47):4791–4806. doi:10.1093/eurheartj/ehab551
20. Di Angelantonio E, Sarwar N, Perry P, et al. Major lipids, apolipoproteins, and risk of vascular disease. JAMA. 2009;302(18):1993–2000. doi:10.1001/jama.2009.1619
21. Nordestgaard BG, Varbo A. Triglycerides and cardiovascular disease. Lancet. 2014;384(9943):626–635. doi:10.1016/S0140-6736(14)61177-6
22. Vallejo-Vaz AJ, Fayyad R, Boekholdt SM, et al. Triglyceride-rich lipoprotein cholesterol and risk of cardiovascular events among patients receiving statin therapy in the TNT trial. Circulation. 2018;138(8):770–781. doi:10.1161/CIRCULATIONAHA.117.032318
23. Members TF, Societies EN, ESC Committee for Practice Guidelines (CPG). 2019 ESC/EAS guidelines for the management of dyslipidaemias: lipid modification to reduce cardiovascular risk. Atherosclerosis. 2019;290:140–205. doi:10.1016/j.atherosclerosis.2019.08.014
24. Varbo A, Nordestgaard BG. Remnant cholesterol and risk of ischemic stroke in 112,512 individuals from the general population. Ann Neurol. 2019;85(4):550–559. doi:10.1002/ana.25432
25. Wadström BN, Wulff AB, Pedersen KM, Jensen GB, Nordestgaard BG. Elevated remnant cholesterol increases the risk of peripheral artery disease, myocardial infarction, and ischemic stroke: a cohort-based study. Eur Heart J. 2022;43(34):3258–3269. doi:10.1093/eurheartj/ehab705
26. Virani SS, Morris PB, Agarwala A, et al. 2021 ACC expert consensus decision pathway on the management of ASCVD risk reduction in patients with persistent hypertriglyceridemia: a report of the American College of cardiology solution set oversight committee. J Am Coll Cardiol. 2021;78(9):960–993. doi:10.1016/j.jacc.2021.06.011
27. Chapman MJ, Ginsberg HN, Amarenco P, et al. Triglyceride-rich lipoproteins and high-density lipoprotein cholesterol in patients at high risk of cardiovascular disease: evidence and guidance for management. Eur Heart J. 2011;32(11):1345–1361. doi:10.1093/eurheartj/ehr112
28. Stegemann C, Pechlaner R, Willeit P, et al. Lipidomics profiling and risk of cardiovascular disease in the prospective population-based Bruneck study. Circulation. 2014;129(18):1821–1831. doi:10.1161/CIRCULATIONAHA.113.002500
29. Rhee EP, Cheng S, Larson MG, et al. Lipid profiling identifies a triacylglycerol signature of insulin resistance and improves diabetes prediction in humans. J Clin Invest. 2011;121(4):1402–1411. doi:10.1172/JCI44442
30. Eichelmann F, Sellem L, Wittenbecher C, et al. Deep lipidomics in human plasma: cardiometabolic disease risk and effect of dietary fat modulation. Circulation. 2022;146(1):21–35. doi:10.1161/CIRCULATIONAHA.121.056805
31. Lu J, Chen B, Chen T, et al. Comprehensive metabolomics identified lipid peroxidation as a prominent feature in human plasma of patients with coronary heart diseases. Redox Biol. 2017;12:899–907. doi:10.1016/j.redox.2017.04.032
32. Mundra PA, Barlow CK, Nestel PJ, et al. Large-scale plasma lipidomic profiling identifies lipids that predict cardiovascular events in secondary prevention. JCI Insight. 2018;3(17). doi:10.1172/jci.insight.121326
33. van der Veen JN, Kennelly JP, Wan S, Vance JE, Vance DE, Jacobs RL. The critical role of phosphatidylcholine and phosphatidylethanolamine metabolism in health and disease. Biochim Biophys Acta Biomembr. 2017;1859:1558–1572. doi:10.1016/j.bbamem.2017.04.006
34. Ménégaut L, Jalil A, Thomas C, Masson D. Macrophage fatty acid metabolism and atherosclerosis: the rise of PUFAs. Atherosclerosis. 2019;291:52–61. doi:10.1016/j.atherosclerosis.2019.10.002
35. Bhatt DL, Steg PG, Miller M, et al. Cardiovascular risk reduction with icosapent ethyl for hypertriglyceridemia. N Engl J Med. 2019;380(1):11–22. doi:10.1056/NEJMoa1812792
36. Manson JE, Cook NR, Lee IM, et al. Marine n-3 fatty acids and prevention of cardiovascular disease and cancer. N Engl J Med. 2019;380(1):23–32. doi:10.1056/NEJMoa1811403
37. Sabogal-Guáqueta AM, Villamil-Ortiz JG, Arias-Londoño JD, Cardona-Gómez GP. Inverse Phosphatidylcholine/Phosphatidylinositol Levels as Peripheral Biomarkers and Phosphatidylcholine/Lysophosphatidylethanolamine-Phosphatidylserine as Hippocampal Indicator of Postischemic Cognitive Impairment in Rats. Front Neurosci. 2018;12:989. doi:10.3389/fnins.2018.00989
38. Summers SA, Chaurasia B, Holland WL. Metabolic Messengers: ceramides. Nat Metab. 2019;1(11):1051–1058. doi:10.1038/s42255-019-0134-8
39. Laaksonen R, Ekroos K, Sysi-Aho M, et al. Plasma ceramides predict cardiovascular death in patients with stable coronary artery disease and acute coronary syndromes beyond LDL-cholesterol. Eur Heart J. 2016;37(25):1967–1976. doi:10.1093/eurheartj/ehw148
40. Meeusen JW, Donato LJ, Bryant SC, Baudhuin LM, Berger PB, Jaffe AS. Plasma Ceramides. Arterioscler Thromb Vasc Biol. 2018;38(8):1933–1939. doi:10.1161/ATVBAHA.118.311199
41. Havulinna AS, Sysi-Aho M, Hilvo M, et al. Circulating ceramides predict cardiovascular outcomes in the population-based FINRISK 2002 cohort. Arterioscler Thromb Vasc Biol. 2016;36(12):2424–2430.
42. Vasile VC, Meeusen JW, Medina Inojosa JR, et al. Ceramide scores predict cardiovascular risk in the community. Arterioscler Thromb Vasc Biol. 2021;41(4):1558–1569. doi:10.1161/ATVBAHA.120.315530
43. Vitturi BK, Gagliardi RJ. The influence of statin withdrawal and adherence on stroke outcomes. Neurol Sci. 2021;42(6):2317–2323. doi:10.1007/s10072-020-04790-y
 © 2024 The Author(s). This work is published and licensed by Dove Medical Press Limited. The
full terms of this license are available at https://www.dovepress.com/terms.php
and incorporate the Creative Commons Attribution
- Non Commercial (unported, v3.0) License.
By accessing the work you hereby accept the Terms. Non-commercial uses of the work are permitted
without any further permission from Dove Medical Press Limited, provided the work is properly
attributed. For permission for commercial use of this work, please see paragraphs 4.2 and 5 of our Terms.
© 2024 The Author(s). This work is published and licensed by Dove Medical Press Limited. The
full terms of this license are available at https://www.dovepress.com/terms.php
and incorporate the Creative Commons Attribution
- Non Commercial (unported, v3.0) License.
By accessing the work you hereby accept the Terms. Non-commercial uses of the work are permitted
without any further permission from Dove Medical Press Limited, provided the work is properly
attributed. For permission for commercial use of this work, please see paragraphs 4.2 and 5 of our Terms.