")
Back to Journals » Biologics: Targets and Therapy » Volume 13
TRIP6 functions as a potential oncogene and facilitated proliferation and metastasis of gastric cancer
Authors Zhu L, Xu X, Tang Y, Zhu X
Received 23 October 2018
Accepted for publication 19 February 2019
Published 11 June 2019 Volume 2019:13 Pages 101—110
DOI https://doi.org/10.2147/BTT.S191863
Checked for plagiarism Yes
Review by Single anonymous peer review
Peer reviewer comments 2
Editor who approved publication: Dr Doris Benbrook
Lirong Zhu,1* Xiaodong Xu,2* Yijie Tang,3 Xiaochao Zhu4
1Department of General Surgery, Affiliated Hospital of Nantong University, Nantong, Jiangsu, People’s Republic of China; 2Department of General Surgery, Yancheng First People’s Hospital, Yancheng, Jiangsu, People’s Republic of China; 3Department of Clinical Medicine, Medical College of Nantong University, Nantong, Jiangsu, People’s Republic of China; 4Department of General Surgery, Suqian First People’s Hospital, Suqian, Jiangsu, People’s Republic of China
*These authors contributed equally to this work
Background: Increasing evidence suggests that TRIP6 has been considered to be aberrantly regulated in several malignancies and involved in tumor growth and metastasis. However, the biological role and prognostic significance of TRIP6 in gastric cancer (GC) still remains unclear.
Materials and methods: TRIP6 expression was determined in matched GC tissues and adjacent normal tissues by western blot and real-time PCR. Then, immunohistochemistry was used to detect the expression of TRIP6 in GC patients. Statistical analysis was performed to evaluate the correlation between TRIP6 expression and clinicopathological characteristics and prognosis. Moreover, the effects of TRIP6 on GC cell proliferation and migration were also investigated by using MTT, colony formation and transwell assays.
Results: We observed that the expression of TRIP6 was significantly up-regulated in GC tissues and cell ines. Our data indicated that high TRIP6 expression exhibited a significant correlation with poor prognosis for GC patients. Multivariate analysis showed that TRIP6 expression was an independent prognostic factor of the overall survival of GC patients. Furthermore, ectopic expression of TRIP6 promotes cell proliferation and migration in BGC823 cells, whereas knockdown of TRIP6 suppresses cell proliferation and migration in MKN45 cells.
Conclusion: These findings demonstrate that TRIP6 exerts an important role in cancer development, which represents a potential prognostic indicator in GC.
Keywords: gastric cancer, TRIP6, prognosis
Introduction
According to WHO,Gastric cancer (GC) is one of the most prevalent malignant diseases and a leading cause of cancer-related death worldwide.1 In recent years, despite some significant advances have been obtained in surgery, chemotherapy and radiotherapy, the mortality of GC still increases in China and the overall 5-year survival rate remains very low.2 Therefore, it is necessary to investigate the molecular mechanisms underlying the development and progression of GC and to develop new therapeutic strategies to prevent GC metastasis.
TRIP6 is a 476aa protein that belongs to the zyxin family and focal adhesion molecule.3 TRIP6 links with many of molecules from the cell surface to the nucleus, and functions as a platform for the recruitment of a number of molecules related to actin assembly, cell motility, antiapoptotic signaling, and transcriptional regulation.4 Moreover, TRIP6 is involved in crucial cellular processes, including cell proliferation, differentiation and survival. Increasing numbers of studies showed that TRIP6 was dysregulated in various cancers and might have vital roles in cancerous initiation, proliferation and metastasis.5 Subsequently, TRIP6 was reported in several cancers. For example, TRIP6 exhibited crucial regulatory effects on cell migration behavior of glioblastoma,6 ovarian cancer,7 lung cancer,8 breast cancer9 and colon cancer.10 However, there has not been research reporting the expression and functions of TRIP6 in GC.
Based on our present study, we showed that TRIP6 expression was upregulated in GC cells and tissues, and overexpression of TRIP6 promoted, while knockdown of TRIP6 inhibited, the growth and tumorigenesis of GC. Finally, our reports suggest that TRIP6 may be a potential therapeutic target for patients with GC.
Materials and methods
Tissue samples
We collected paraffin-embedded 136 tissue samples from GC patients who underwent surgical resection at the Affiliated Hospital of Nantong University between January 2008 and December 2011. No patients received prior radiotherapy or chemotherapy. Fresh samples were obtained randomly from 26 GC patients and frozen at −80 °C until required for western blot and qPCR analysis. Written informed consent was obtained from each patient. The present study was approved by the Institutional Ethics Board of Affiliated Hospital of Nantong University, and was conducted in accordance with the Declaration of Helsinki.
RNA extraction and quantitative real-time PCR
Total RNA was extracted from tissues and cell lines lysate using Trizol (Invitrogen, Carlsbad, CA). Then cDNA was synthesized from total RNA using an Omniscript RT kit (Qiagen, Valencia, CA). qPCR was conducted on the Mastercycler Ep Realplex (Eppendorf 2S, Hamburg, Germany). The cycling procedures: preliminary denaturation at 96 °C for 2 min, followed by 40 cycles of denaturation at 96 °C for 15 s, annealing at 60 °C for 1 min and extension at 60 °C for 1 min. GAPDH was selected for normalization. The expression levels of each circulating target gene are expressed as the threshold cycle (Ct) values, and duplicate Ct values were analyzed by using a 2−ΔΔCt relative quantification. All reactions were run in triplicate. The sequences of the primers for TRIP6 as follows: TRIP6 forward: 5ʹ-GGCTGTTACAAGTGCGAGGAGT-3ʹ; TRIP6 reverse: 5ʹ-GGATGGGAACTGGAACTGAGAAC-3ʹ.
Protein extraction and western blot analysis
Protein was extracted from tissues and cells using RIPA buffer. After centrifugation at 12,000 rpm for 20 min, the supernatant was collected for measure of total protein concentration by DC-protein assay (Bio-Rad) to keep the same loads. Protein samples were electrophoretically separated on a 10% SDS-PAGE, and transferred to a PVDF membrane. After blocking with 5% non-fat dry milk in TBST buffer, the membrane was incubated with Rabbit polyclonal anti-human TRIP6 antibody (1:500, ab137478, Abcam, Cambridge, UK) at 4 °C overnight. The membranes were washed three times with TBST buffer for 5 min, and then incubated with secondary antibody, anti-rabbit IgG conjugated IRDye800 (1:5000, Rockland Gilbertsville, CA) at room temperature for 2 h. Finally, membranes were scanned with an Odyssey infrared imaging system (LI-COR, Lincoln, NE), and analyzed with PDQuest7.2.0 software (Bio-Rad).
Immunohistochemistry (IHC) analysis
Briefly, core tissue biopsies (2 mm in diameter) were derived from individual paraffin-embedded sections and arranged in recipient paraffin blocks. TMA specimens were cut into 4 μm sections and put on super frost-charged glass microscope slides. TMA analysis was used as a quality control for hematoxylin and eosin staining. Tissue sections were deparaffinized and rehydrated in graded ethanol. Antigen retrieval was performed by boiling sections in ethylene diaminetetra-acetic acid buffer, pH 6.0, for 3 min in a pressure cooker. Endogenous peroxidase activity was quenched with 3% hydrogen peroxide for 30 min. TMA slides were stained using Rabbit polyclonal anti-TRIP6 antibody (1:200, ab137478, Abcam, Cambridge, UK) at 4 °C overnight. Then by incubation with a horseradish-peroxidase-conjugated anti-rabbit secondary antibody (Sigma-Aldrich, St. Louis, MO, USA) at 37 °C for 30 min. Slides were then processed using horseradish peroxidase and 3,3-diaminobenzidine chromogen solution and counterstained with hematoxylin. The evaluation of TRIP6 expression was based on both the staining intensity and the percentage of cells at that intensity. According to traditional semiquantitative pathology scoring, staining intensity was scored as follows: 0 (−, no staining), 1 (+, weak staining), 2 (++, moderate staining), or 3 (+++, intense staining). The percentage of cells stained at intensity was determined and multiplied by the intensity score to generate an intensity percentage score. The final staining score of each tissue sample was the sum of the four intensity percentage scores, and these scores ranged from 0 (no staining) to 300 (100% of cells with +++ staining intensity).
Cell culture and transfection
The normal gastric epithelial cell line, GES-1, and the human GC cell lines, MKN45, SGC7901, BGC823, AGS and MKN28 were purchased from the Cell Bank of the Chinese Academy of Sciences (Shanghai, China). All cell lines were cultured in DMEM or RPMI-1640 Medium (Gibco) supplemented with 10% fetal bovine serum (FBS; Invitrogen), at 37 °C in a humidified atmosphere with 5% CO2.
For overexpression of endogenous TRIP6, the coding sequence of TRIP6 was amplified and subcloned into the pcDNA3.1(+) vector (Invitrogen, Carlsbad, CA, USA) according to the manufacturer’ instructions. BGC823 cells were then transfected with a negative control vector or a TRIP6 expressing plasmid using lipofectamine 2000 (Invitrogen, Carlsbad, CA, USA). To effectively reduce endogenous TRIP6 expression in cells, siRNA duplex oligonucleotides targeting human TRIP6 mRNA (si-TRIP6) was obtained from GenePharma (Shanghai, China). The sequence was: si-TRIP6 sense: 5′-GUAUGACUUUGUCACCAAAUG-3′, Anti-sense: 5′-UUUGGUGACAAAGUCAUACAG-3′. The sequence for scrambled siRNA sense was 5′-GCCUCAAGAUCAUCAGCAAUG-3′, Anti-sense: 5′-UUGCUGAUGAUCUUGAGGCUG-3′. MKN45 cells were transfected with si-TRIP6 or scramble siRNA according to the manufacturer’s instructions.
Cell proliferation assay
Cell viability was examined by using MTT assay. All cells were plated in 96-well plates at f 5×10³ cells/well for 48 h. After transfection, cells were treated by using MTT dye (5 mg/mL) for 4 h, and then the medium was replaced by 150 ul DMSO. All samples were measured at 490 nm spectrophotometric absorbance. All experiments were performed in triplicate.
Colony formation assay
After transfection, cells (1×10³/well) were seeded in a 6-well plate and cultured for 14 days at 37 °C with 5% CO2 humidified air. Surviving colonies were stained with 0.1% crystal violet (1 mg/ml) and the numbers of colonies containing more than 50 cells were counted. The experiment was carried out in triplicate wells for three times.
Cell migration assay
According to the manufacturer’s instruction, cell migration was measured by using transwell chamber assay (Millipore, Billerica, MA, USA). 5×10⁴ cells were suspended in 200 μl serum-free DMEM medium and plated on the upper chamber of each insert. As the chemotactic factor, 800 μl of DMEM containing 10% FBS was added to the lower chamber. After incubation at 37 °C, the cells that migrated were fixed and stained for 30 min in a dye solution containing 0.2% crystal violet and 20% methanol. The numbers of migrated cells were calculated and photographed under a microscope at 200× magnification in random fields in each well. All experiments were performed three times.
Statistical analysis
Statistical analysis was performed using SPSS 17.0 statistical software (SPSS, Inc., Chicago, IL, USA). All of the data are presented as the mean ± SD. Differences among variables were assessed by χ2 analysis, Student’s t-test or ANOVA. P-value <0.05 was considered to be statistical significance.
Results
TRIP6 is up-regulated in primary GC tissues and cell lines
The protein and mRNA level of TRIP6 in GC tissues and cell lines was examined by qPCR and western blot. In matched primary GC tissues and adjacent non-tumorous tissues, western blot analysis displayed that up-regulation of TRIP6 in tumor tissues compared with adjacent non-tumorous tissues (Figure 1A and 1B, *P<0.05). And TRIP6 mRNA level was elevated in 30 of 36 tumor tissues compared with that of non-tumorous tissues (Figure 1C, P<0.001). In addition, western blot analysis revealed that TRIP6 expression levels were higher in GC cell lines than that of GES-1 cell lines (Figure 1D and 1E). To further confirm this result, real-time PCR analysis confirmed that the level of TRIP6 mRNA was increased in all four GC cell lines (Figure 1F).
 | Figure 1 TRIP6 is up-regulated in GC tissues and cell lines. (A and B) TRIP6 protein expression levels in matched GC tissues and adjacent non-tumorous tissues (n=24). (C) TRIP6 mRNA expression levels in 36 paired GC tissues and adjacent non-tumorous tissue (P<0.001). (D and E) TRIP6 protein expression levels in four GC cell lines and a normal gastric epithelial cell GES-1. (F) TRIP6 mRNA expression levels in GC cell lines and a normal gastric mucosa cell line GES-1. *P<0.05. Abbreviation: GC, gastric cancer. |
The correlations between TRIP6 expression and various clinicopathological characteristics
TRIP6 expression was determined by TMA-based immunohistochemistry (IHC) studies. Our results found that TRIP6 expression level in GC tissues and adjacent tissues were different, that TRIP6 expression was evidently up-regulated in GC tissues but negative or low in non-tumor normal tissues (Figure 2). Overall, high TRIP6 expression (TRIP6++ or TRIP6+++) was displayed in 84 of 136 GC tissues (61.8%), while (38.2%) of GC tissues showed low TRIP6 expression (TRIP6− or TRIP6+).
 | Figure 2 Representative pattern of TRIP6 expression in GC tissues and adjacent non-cancerous tissue as determined with IHC analysis with tissue microarrays. (A) Negative staining in adjacent non-tumor tissues, scored as TRIP6 (−). (B) Weak staining in well-differentiated GC tissues, scored as TRIP6 (+). (C) Moderate staining in moderately differentiated GC tissues, scored as TRIP6 (++). (D) Strong staining in poorly differentiated GC tissues, scored as TRIP6 (+++). Original magnification ×40 or ×400. |
Furthermore, the relationship between the degree of TRIP6 immunohistochemical staining and clinicopathological characteristics was evaluated by the chi-squared analysis. Then we showed that the expression level of TRIP6 in cancer tissues was significantly associated with various clinicopathological factors, including TNM stage, histological differentiation, and distance metastasis, but not with gender, age, tumor size, tumor numbers, location (Table 1).
 | Table 1 Clinicopathological features of GC in relation to the TRIP6 expression |
TRIP6 promotes GC growth and proliferation in vitro
We further investigated the effects of TRIP6 on the cancer cell growth and proliferation by using MTT and colony formation assays. AGS cells were transfected with pcDNA3.1-TRIP6 to overexpress TRIP6 (Figure 3A and 3B). The results of MTT assay revealed that ectopic expression of TRIP6 obviously stimulated the viability of BGC823 cells (Figure 3C, *P<0.05). Colony formation assay also showed the numbers of colonies were significantly increased in TRIP6 overexpressing cells compared with control cells (Figure 4A, *P<0.05). Furthermore, the influence of TRIP6 on cellular growth and proliferation was confirmed after TRIP6 knockdown in MKN45 cells. As indicated in Figures 3D and 4B, knockdown of TRIP6 distinctly suppressed the growth rate and colony formation ability of MKN45 cells (*P<0.05) compared with that of control cells.
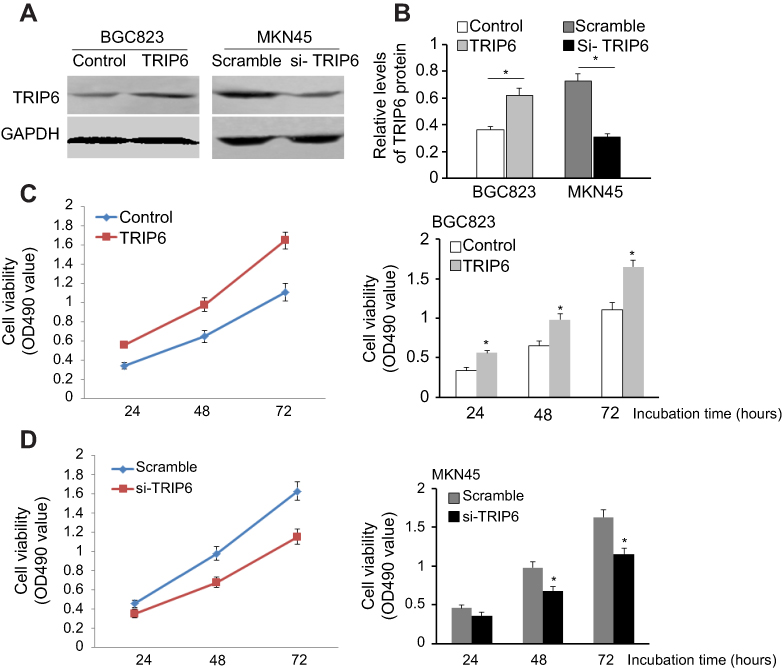 | Figure 3 TRIP6 promotes cell proliferation in GC cells. (A and B) TRIP6 protein level is up-regulated after over-expression of TRIP6 in BGC823 cells and down-regulated after silencing of TRIP6 in MKN45 cells. (C and D) MTT assays determined that ectopic expression of TRIP6 promotes cell proliferation in BGC823 cells whereas knockdown of TRIP6 inhibits cell proliferation in MKN45 cells (*P<0.05). |
 | Figure 4 TRIP6 promotes colony formation and cell migration in GC cells. (A) Ectopic expression of TRIP6 stimulates colony formation in BGC823 cells. (B) Knockdown of TRIP6 expression inhibits colony formation in MKN45 cells (*P<0.05). (C) Transwell assays showed that ectopic expression of TRIP6 promotes cell migration in BGC823 cells. (D) Knockdown of TRIP6 expression suppresses cell migration in MKN45 cells (*P<0.05). Abbreviation: GC, gastric cancer. |
TRIP6 promotes cell migration in vitro
In order to confirm the role of TRIP6 expression in tumorigenesis of GC cells in vivo, we conducted the transwell assays to evaluate the cellular migration. After BGC823 cells were transfected with TRIP6 overexpressing or control plasmid, the migratory abilities were confirmed later. The results indicated ectopic expression of TRIP6 significantly elevated the migratory capacity of BGC823 cells (Figure 4C, *P<0.05). In contrast, knockdown of TRIP6 significantly decreased the migrated cell number of MKN45 (Figure 4D, *P<0.05).
The association between TRIP6 expression and patient survival
To further estimate the prognostic value of TRIP6 in patients with GC, survival analysis of the high and low TRIP6 expression groups was evaluated using kaplan-Meier survival curves and the log-rank test. Compared with the high expression group, patients with low TRIP6 expression exhibited a longer overall survival time (P<0.001; Figure 5). According to Multivariate Cox regression analysis, it was showed that the expression of TRIP6 was significantly associated with the overall survival time of GC patients (Table 2).
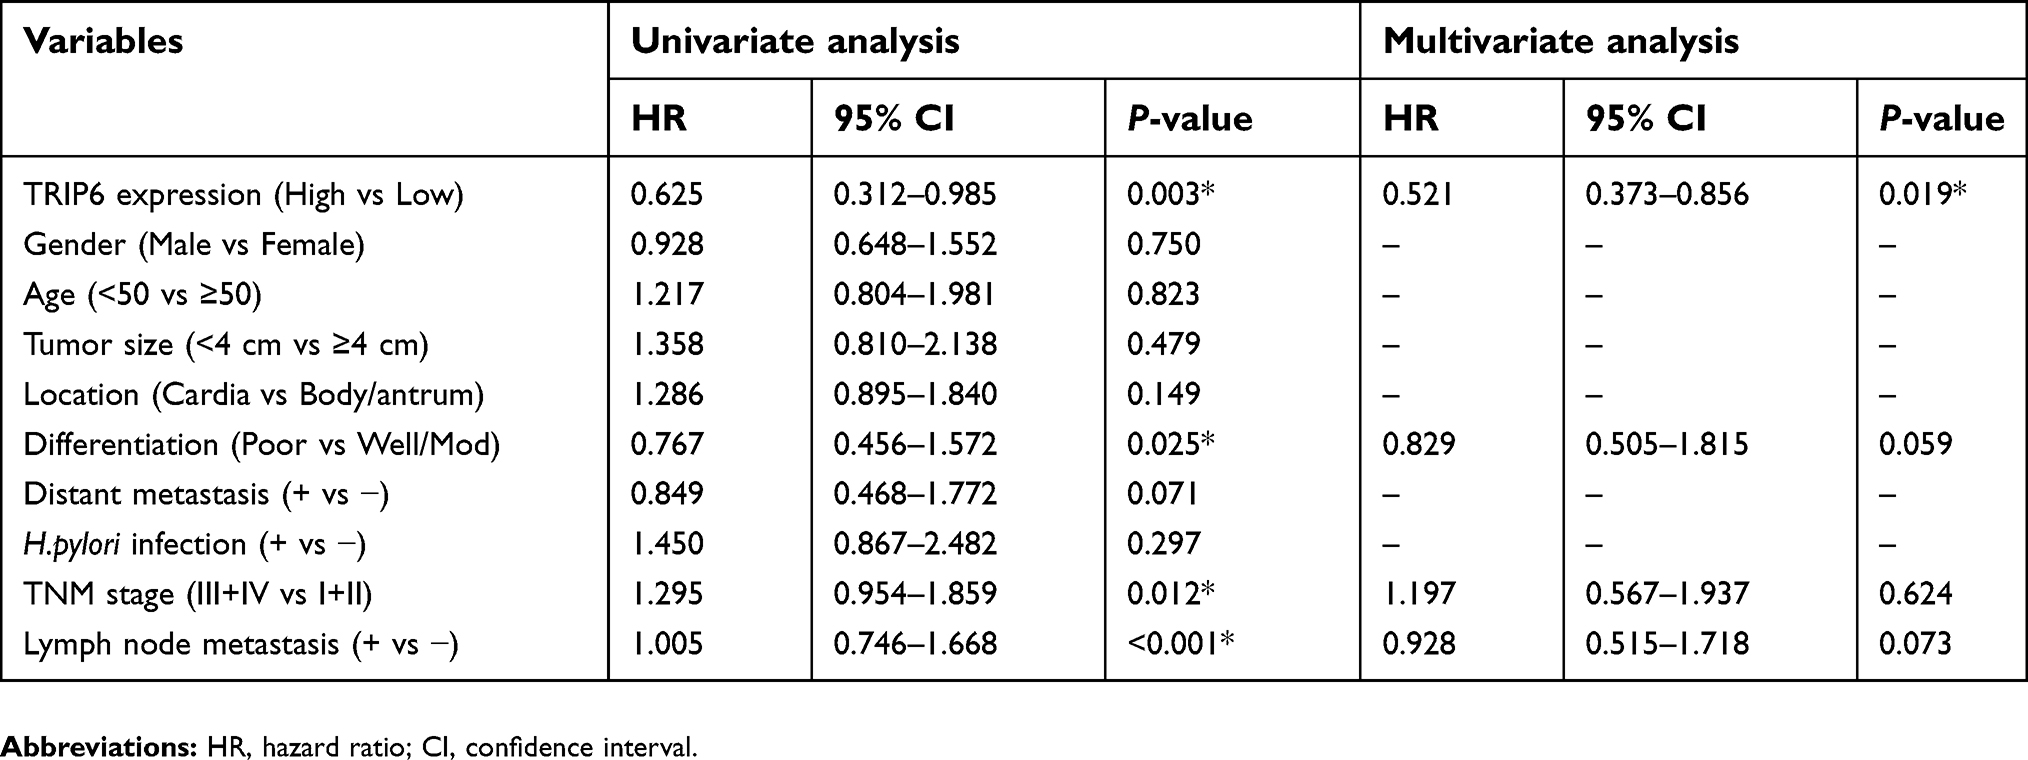 | Table 2 Cox proportional hazards model analysis of prognostic factors |
 | Figure 5 Prognostic significance of TRIP6 expression in GC patients. Kaplan-Meier curves for overall survival in GC patients with low level and high levels of TRIP6 expression (χ2=15. 97, P<0.001). Abbreviation: GC, gastric cancer. |
TRIP6 induces the epithelial-mesenchymal transition (EMT) phenotypes
Evidences have revealed that EMT is a dynamic and reversible process during which epithelial cells dissolve their junctions and finally acquire motility and invasiveness,11 which is critical for multiple pathophysiological processes, especially tumorigenesis and progression.12 So the expression of EMT markers was examined. E‑cadherin expression was reduced, whereas vimentin expression was upregulated in the TRIP6‑overexpressing cells, as analyzed by western blot. EMT induction was exhibited by a shift from the expression of epithelial markers (E‑cadherin) to mesenchymal markers (vimentin and Snail) (Figure 6, *P<0.05).
 | Figure 6 TRIP6 regulates EMT in vitro. E‑cadherin, Snail and vimentin expression in BCG823 and MKN45 cells transfected with TRIP6 over-expression or vector stable cells were detected by Western blot. *P<0.05. |
Discussion
Nowadays, many advanced GC patients have a poor prognosis. Therefore, a better understanding of the molecular mechanisms underlying the development and progression of GC can lead to improve early disease diagnosis and provide more effective therapeutic strategies. In this study, our results found that expression of TRIP6 was higher in GC cells and tissues than in normal gastric mucosa cells and adjacent non-tumorous tissues. We also considered that the potential influence of TRIP6 on tumor cell behavior because of its location on chromosome 7q22 at a region that is often rearranged or deleted in human cancers.13 Several studies have described that knockdown of TRIP6 expression remarkably inhibited migration, invasion, long-term proliferation, and clonogenicity of Ewing sarcoma cells in vitro as well as tumorigenicity in vivo.14 Some reports also found that TRIP6 overexpression and promoted NF-κB activity in glioblastoma are linked with increased cellular invasiveness.15 Furthermore, overexpression of TRIP6 leads to obvious enhancement of nasopharyngeal cancer cell migration.16 Consistently, overexpression of TRIP6 fosters colorectal cancer cell migration and invasion in a Phosphoinositide 3-kinase (PI3K)- and NF-κB-dependent manner.10 In addition, another study found that TRIP6 can reduce cell migration by interfering Cas/Crk signaling.17 TRIP6 also can regulate prosurvival signaling by activating NF-κB, ERK and PI3K/AKT, and nuclear TRIP6 serves as a transcriptional coregulator of AP-1 and NF-κB, which indicates that TRIP6 plays an important part in a point of convergence of multiple signaling pathways critical for tumor progression.6 In the present study, we showed that ectopic expression of TRIP6 enhanced cancer growth, proliferation and migration whereas silencing of TRIP6 inhibited cellular growth, motility and metastasis of GC cells. Furthermore, in keeping with Kaplan-Meier survival, it displayed that high expression of TRIP6 significantly associates with shorter survival time of GC patients. Moreover, multivariate analysis revealed that TRIP6 expression was an independent prognostic indicator of the overall survival rate of patients with GC. Furthermore, our studies have shown that TRIP6 induces EMT phenotypes, and we hypothesized that EMT was essential for promoting migration.
Taken all together, TRIP6 was up-regulated in GC, and aberrant expression of TRIP6 can influence cell growth, proliferation and migration of GC. Hence, inhibitory strategy against TRIP6 might serve as a potential therapeutic target for GC. In addition, further research will be essential to investigate thoroughly the molecular mechanism controlling the function of TRIP6 in GC.
Acknowledgment
This study was supported by Scientific Research of “333 Project” in Jiangsu Province (BRA2016257).
Disclosure
The authors report no conflicts of interest in this work.
References
1. Uthman OA, Elham J, Tahereh M. Socioeconomic position and incidence of gastric cancer: a systematic review and meta-analysis. J Epidemiol Commun Health. 2013;67(10):854–860. doi:10.1136/jech-2012-201108
2. Hartgrink HH, Jansen EP, van Grieken NC, et al. Gastric cancer. Lancet. 2009;374(9688):477–490. doi:10.1016/S0140-6736(09)60617-6
3. Murthy KK, Clark K, Fortin Y, et al. ZRP-1, a zyxin-related protein, interacts with the second PDZ domain of the cytosolic protein tyrosine phosphatase hPTP1E. J Biol Chem. 1999;274(29):20679–20687.
4. Lin VT, Lin FT. TRIP6: an adaptor protein that regulates cell motility, antiapoptotic signaling and transcriptional activity. Cell Signal. 2011;23(11):1691–1697. doi:10.1016/j.cellsig.2011.06.004
5. Willier S, Butt E, Richter GH, et al. Defining the role of TRIP6 in cell physiology and cancer. Biol Cell. 2012;103(12):573–591. doi:10.1042/BC20110077
6. Lin VT, Lin VY, Lai YJ, et al. TRIP6 regulates p27 KIP1 to promote tumorigenesis. Mol Cell Biol. 2013;33(7):1394–1409. doi:10.1128/MCB.01149-12
7. Xu J, Lai YJ, Lin WC, et al. TRIP6 enhances lysophosphatidic acid-induced cell migration by interacting with the lysophosphatidic acid 2 receptor. J Biol Chem. 2004;279(11):10459–10468. doi:10.1074/jbc.M311891200
8. Gur’Ianova OA, Sablina AA, Chumakov PM, et al. Down-regulation of TRIP6 expression induces actin cytoskeleton rearrangements in human carcinoma cell lines. Mol Biol. 1900;39(5):905–909.
9. Huggins CJ, Andrulis IL. Cell cycle regulated phosphorylation of LIMD1 in cell lines and expression in human breast cancers. Cancer Lett. 2008;267(1):55–66. doi:10.1016/j.canlet.2008.03.015
10. Chastre E, Abdessamad M, Kruglov A, et al. TRIP6, a novel molecular partner of the MAGI-1 scaffolding molecule, promotes invasiveness. Faseb J Off Publ Fed Am Soc Exp Biol. 2009;23(3):916. doi:10.1096/fj.09-131961
11. Thiery J, Acloque H, Huang R, et al. Epithelial-mesenchymal transitions in development and disease. Cell. 2009;139(5):871–890. doi:10.1016/j.cell.2009.11.007
12. De Craene B, Berx G. Regulatory networks defining EMT during cancer initiation and progression. Nat Rev Cancer. 2013;13(2):97–110. doi:10.1038/nrc3447
13. Yi J, Beckerle MC. The human TRIP6 gene encodes a LIM domain protein and maps to chromosome 7q22, a region associated with tumorigenesis. Genomics. 1998;49(2):314–316. doi:10.1006/geno.1998.5248
14. Grunewald TG, Willier S, Janik D, et al. The Zyxin-related protein thyroid receptor interacting protein 6 (TRIP6) is overexpressed in Ewing’s sarcoma and promotes migration, invasion and cell growth. Biol Cell. 2013;105(11):535–547. doi:10.1111/boc.201300041
15. Lai YJ, Lin VT, Zheng Y, et al. The adaptor protein TRIP6 antagonizes Fas-induced apoptosis but promotes its effect on cell migration. Mol Cell Biol. 2010;30(23):5582–5596. doi:10.1128/MCB.00134-10
16. Fei J, Li J, Shen S, et al. Characterization of TRIP6-dependent nasopharyngeal cancer cell migration. Tumour Biol J Int Soc Oncodevelop Biol Med. 2013;34(4):2329. doi:10.1007/s13277-013-0780-5
17. Yi J, Kloeker S, Jensen CC, et al. Members of the Zyxin family of LIM proteins interact with members of the p130Cas family of signal transducers. J Biol Chem. 2015;277(11):9580–9589. doi:10.1074/jbc.M106922200
 © 2019 The Author(s). This work is published and licensed by Dove Medical Press Limited. The
full terms of this license are available at https://www.dovepress.com/terms.php
and incorporate the Creative Commons Attribution
- Non Commercial (unported, v3.0) License.
By accessing the work you hereby accept the Terms. Non-commercial uses of the work are permitted
without any further permission from Dove Medical Press Limited, provided the work is properly
attributed. For permission for commercial use of this work, please see paragraphs 4.2 and 5 of our Terms.
© 2019 The Author(s). This work is published and licensed by Dove Medical Press Limited. The
full terms of this license are available at https://www.dovepress.com/terms.php
and incorporate the Creative Commons Attribution
- Non Commercial (unported, v3.0) License.
By accessing the work you hereby accept the Terms. Non-commercial uses of the work are permitted
without any further permission from Dove Medical Press Limited, provided the work is properly
attributed. For permission for commercial use of this work, please see paragraphs 4.2 and 5 of our Terms.