")
Back to Journals » Journal of Inflammation Research » Volume 17
Tumor Cell-Derived Exosomal Hybrid Nanosystems Loaded with Rhubarbic Acid and Tanshinone IIA for Sepsis Treatment
Authors Wu Q, Dong QQ, Wang SH, Lu Y, Shi Y, Xu XL , Chen W
Received 4 January 2024
Accepted for publication 12 July 2024
Published 29 July 2024 Volume 2024:17 Pages 5093—5112
DOI https://doi.org/10.2147/JIR.S457978
Checked for plagiarism Yes
Review by Single anonymous peer review
Peer reviewer comments 5
Editor who approved publication: Professor Ning Quan
Qian Wu,1,* Qing-Qing Dong,1,* Si-Hui Wang,1 Yi Lu,1 Yi Shi,1 Xiao-Ling Xu,2 Wei Chen1
1ICU, Longhua Hospital Affiliated to Shanghai University of Traditional Chinese Medicine, Shanghai, People’s Republic of China; 2Shulan International Medical College, Zhejiang Shuren University, Hangzhou, People’s Republic of China
*These authors contributed equally to this work
Correspondence: Wei Chen, Longhua Hospital Affiliated to Shanghai University of Traditional Chinese Medicine, 725 South WanPing Road, Shanghai, 200032, People’s Republic of China, Tel +86-21-64385700-3522, Email [email protected] Xiao-Ling Xu, Shulan International Medical College, Zhejiang Shuren University, 8 Shuren Street, Hangzhou, 310015, People’s Republic of China, Email [email protected]
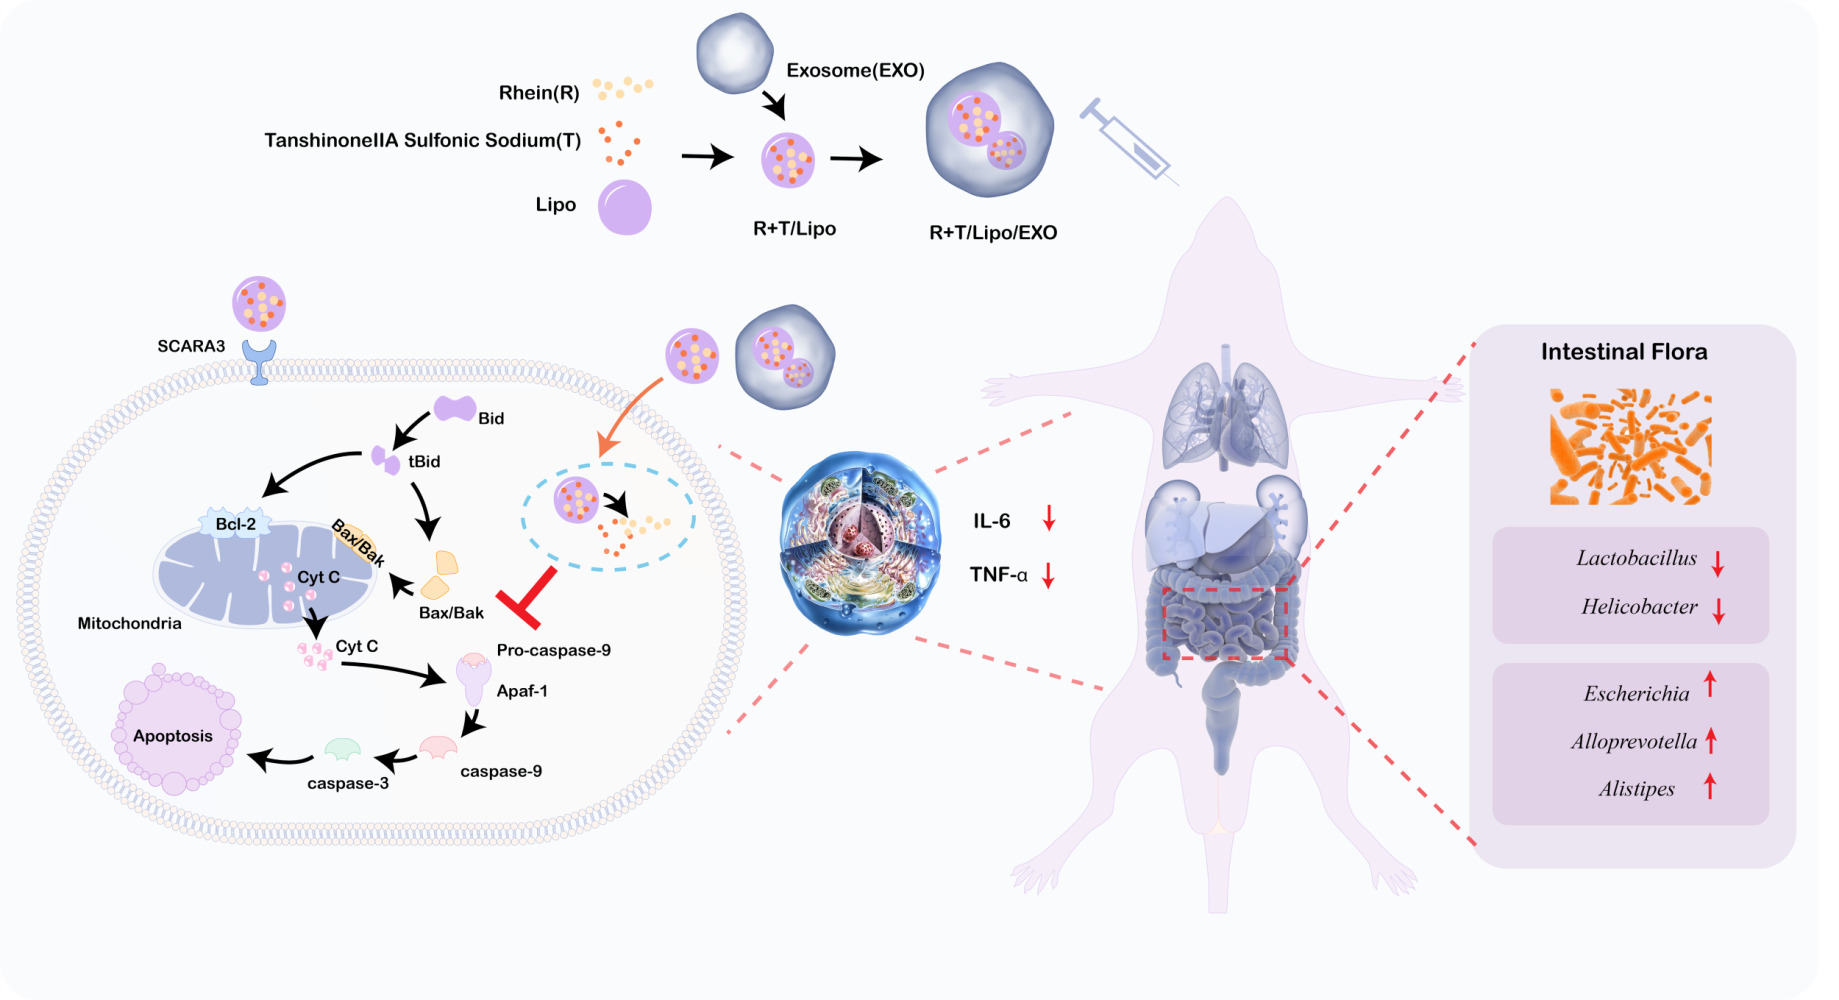
Background: Sepsis continues to exert a significant impact on morbidity and mortality in clinical settings, with immunosuppression, multi-organ failure, and disruptions in gut microbiota being key features. Although rheinic acid and tanshinone IIA show promise in mitigating macrophage apoptosis in sepsis treatment, their precise targeting of macrophages remains limited. Additionally, the evaluation of intestinal flora changes following treatment, which plays a significant role in subsequent cytokine storms, has been overlooked. Leveraging the innate inflammation chemotaxis of tumor cell-derived exosomes allows for their rapid recognition and uptake by activated macrophages, facilitating phenotypic changes and harnessing anti-inflammatory effects.
Methods: We extracted exosomes from H1299 cells using a precipitation method. Then we developed a tumor cell-derived exosomal hybrid nanosystem loaded with rhubarbic acid and tanshinone IIA (R+T/Lipo/EXO) for sepsis treatment. In vitro studies, we verify the anti-inflammatory effect and the mechanism of inhibiting cell apoptosis of nano drug delivery system. The anti-inflammatory effects, safety, and modulation of intestinal microbiota by the nanoformulations were further validated in the in vivo study.
Results: Nanoformulation demonstrated enhanced macrophage internalization, reduced TNF-α expression, inhibited apoptosis, modulated intestinal flora, and alleviated immunosuppression.
Conclusion: R+T/Lipo/EXO presents a promising approach using exosomal hybrid nanosystems for treating sepsis.
Keywords: sepsis, rheinic acid, tanshinone IIA, exosome, hybrid nanosystem
Graphical Abstract:
Introduction
Sepsis continues to exert a significant impact on morbidity and mortality in clinical settings, with immunosuppression, multi-organ failure, and disruptions in gut microbiota being key features.1,2 Recent data indicates a substantial global impact, with an estimated 48.9 million sepsis cases and 11 million sepsis-related deaths occurring worldwide over the past decade, accounting for approximately 19.7% of total global mortality.3 Notably, among hospitalized individuals with COVID-19, 26% exhibit critical illness, thereby increasing the likelihood of sepsis development and even progressing to septic shock.4
Immunosuppression is a critical factor in the progression of sepsis, with apoptosis playing a pivotal role in modulating immune function and cell selectivity.5,6 While cell death within the innate and adaptive immune systems serves to downregulate the inflammatory response during sepsis, excessive loss of immune cells can hamper the host’s ability to effectively eliminate invading pathogens. In particular, apoptosis occurring in lymphoid and gut-associated lymphoid tissues leads to a significant reduction in immune cell populations such as monocytes, macrophages, dendritic cells, natural killer cells, and B cells, thereby contributing to immunosuppression and an increased susceptibility to secondary infections.
Rheinic acid and tanshinone IIA, the major bioactive constituents found in Rhubarb and Tanshin, exhibit promising anti-apoptosis potential.7–9 Rhubarbic acid is an anthraquinone compound primarily present in plants like rhubarb, exhibiting pharmacological properties such as laxative, anti-inflammatory, anti-tumour, and antibacterial effects. However, its bioavailability remains limited due to poor absorption and rapid metabolism within the intestinal tract. While widely utilized and relatively safe in traditional Chinese medicine practices, excessive doses or prolonged usage may result in adverse reactions including diarrhea, hepatotoxicity, nephrotoxicity, and electrolyte imbalances. Experimental investigations have substantiated the high-dose toxicity of rhubarbic acid. Tanshinone IIA, derived from Salvia miltiorrhiza, is a fat-soluble diterpene quinone that exhibits significant pharmacological effects including anti-inflammatory, antioxidant, anti-tumour and cardiovascular protective properties.7–9 However, its low bioavailability can be attributed to poor water solubility and limited intestinal absorption. Despite being widely used in traditional Chinese medicine with generally recognized safety profile, high doses or prolonged usage may result in potential side effects such as hepatotoxicity, nephrotoxicity and haematological abnormalities.7–9 However, their bioavailability and precise targeting of macrophages remains limited.7–9 Additionally, the evaluation of intestinal flora changes following treatment, which plays a significant role in subsequent cytokine storms, has been overlooked.
The emergence of nanoscale drug delivery systems has opened up new avenues for enhancing the bioavailability and offering targeting advantages over conventional drug formulations. Exosomes, which are naturally secreted nanosystems with a lipid bilayer enveloping proteins, lipids, genetic information, and metabolites, exhibit immense potential as targeting agents, facilitating intercellular communication within a size range of 30–150 nm.10 Notably, tumor-derived exosomes have demonstrated the capability to modulate macrophage phenotypes, induce macrophage polarization, and exhibit enhanced anti-inflammatory effects.11 The phenotype of macrophages can be altered by tumor-derived exosomes, which in turn regulate the inflammatory microenvironment through secretion of IL-1β to activate the NLRP3 inflammasome signaling pathway.11 Consequently, exosomes emerge as a promising drug delivery system.12
The gut microbiota exerts a vital role in maintaining dynamic homeostatic mechanisms in healthy individuals, encompassing immune function and preservation of the gut barrier. Perturbations within the gut microbiome prior to sepsis onset contribute to increased susceptibility through various mechanisms, including facilitating the expansion of pathogenic gut bacteria, triggering a robust pro-inflammatory immune response, and impairing the production of beneficial microbial products like short-chain fatty acids. Furthermore, substantial evidence indicates that dysbiosis-generated metabolites from the gut flora are involved in the secondary wave of cytokine storms during sepsis.13 In the context of nanoparticle clearance investigations, it has been demonstrated that certain intravenously administered nanomaterials undergo hepatobiliary clearance, trafficking through the biliary and gastrointestinal tracts, culminating in elimination through fecal excretion.14,15
Therefore, a tumor cell-derived exosomal hybrid nanosystem loaded with rhubarbic acid and tanshinone IIA (R+T/Lipo/EXO) was developed for the treatment of sepsis-induced acute kidney injury. The goal of this treatment is to inhibit macrophage apoptosis, mitigate immunosuppression, and potentially ameliorate sepsis by modulating the intestinal flora. The nanoformulation was characterized by evaluating its morphology, drug release kinetics, and in vitro hemolysis behavior. Furthermore, lipopolysaccharide (LPS)-stimulated macrophages were employed to assess the anti-apoptotic capacity of the formulation. The impact on inflammatory cytokine expression and apoptosis-related protein levels were investigated to elucidate the underlying mechanisms. Additionally, an LPS-induced sepsis mouse model was established to examine the safety profile, in vivo efficacy, and alterations in the intestinal flora upon administration of R+T/Lipo/EXO. It is hypothesized that R+T/Lipo/EXO exhibits enhanced therapeutic effects against sepsis, presenting a novel strategy for the clinical management of this condition.
Materials and Methods
Materials
Exosome extraction kits (serum or plasma) were purchased from Jiangsu Addison Biotechnology Co. CD9, CD63, CD81, TSG101, BAK, Apaf-1, caspase-3, β-Actin, GAPDH, and Anti-rabbit IgG were purchased from Shanghai Biyuntian Biotechnology Co. HRP-linked Antibody was purchased from Cell Signaling Technology, USA. Ltd. cy5-NHS was purchased from Beijing Solaibao Technology Co. The caspase-9 and Cy3-labeled goat anti-rabbit secondary antibodies were purchased from Abcam, UK. TNF-α and IL-6 Kits were purchased from Jiangsu Meimian Industrial Co., Ltd. The dilution ratio of the primary antibody was 1:1000–1:2000 and the dilution rate of the secondary antibody was 1:0000 according to the manufacturer’s instructions. All other solvents were of analytical or chromatographic grade.
Preparation and Characterization of Formulations
Preparation of H1299 Cell Exosomes
The exosome extraction kits extract exosomes by precipitation method.
- Non-small cell lung cancer (NSCLC) cell line H1299 (NCI-H1299) cells were purchased through a commercial channel (Wuhan Pricella Biotechnology Co., Ltd). H1299 in logarithmic growth phase were taken, trypsin digested and seeded separately in 3 bottles of 75 cm2 cell culture flasks, and when the cells grew to the bottom of the culture flask nearly monolayer, they were changed to serum-free medium and the cell culture supernatant was collected after 48 h.
- The collected cell supernatant was placed on ice, 3000 g, 4°C, and centrifuged for 15 min to remove cells and cell debris;
- After centrifugation, the supernatant was concentrated by aspiration into a 30 kDa ultrafiltration tube, 4000 g for 10 min, 10–20 times;
- Take at least 5 mL of cell culture supernatant concentrate into a 15 mL centrifuge tube, add 25 mL of exosome precipitation reagent (Addison Exosome Extraction Kit), invert and mix thoroughly, then let stand at least 30 min at 4°C (the time can be extended appropriately), centrifuge the sample at 12000 g after standing, centrifuge at 4°C for 30 min, and white precipitate is visible at the bottom of the tube, aspirate the supernatant, taking care not to destroy the exosome precipitation;
- Add 100 μL of PBS or the appropriate buffer for downstream applications and mix with repeated pipetting or vortexing to thoroughly dissolve the precipitate; this resuspension contains the intact exosomes;
- Transfer the resuspended exosomes to a purification column (Addison Exosome Extraction Kit), put it into a 1.5 mL collection tube, 2000 g, 4°C, centrifuge for 5 min, discard the purification column, and the collection tube is the extracted exosomes, which can be directly applied to subsequent experiments.
Characterization of H1299 Cell Exosomes
The particle size and concentration of H1299 cellular exosomes (EXO) were determined using a particle size meter. The morphology of EXO was observed by transmission electron microscopy (TEM), and the expression of EXO signature proteins was detected by WB.
Preparation of R+T/Lipo
Prescribed amounts of lecithin (140 mg), Tween 80 (40 mg, 40 µL), and rheinic acid (R) 1 mg (15 mg dissolved in 300 mL anhydrous ethanol 8 mL) were weighed in a 50 mL eggplant bottle, mixed well, vacuumed, and spun at 45°C in a water bath for 60 rpm to remove organic reagents to obtain lipid films. Dissolve 5 mg of tanshinone IIA sodium sulfonate (T) in 10 mL of pH 7.4 buffer, hydrate the lipid film into it, handshake supplemented with water bath ultrasonication to make the film come off completely, ice bath probe ultrasonication for 5 min (250w, 3s working, 3s intermittent) to obtain R+T/Lipo.
Preparation of R+T/Lipo/EXO
5mL R+T/Lipo was mixed with 30 μL of EXO prepared in 2.2.1 and stirred for 48 h. After 48 h, the initially obtained R+T/Lipo/EXO was squeezed with MiNI-Extruder (containing 0.2 μm and 19 mm polycarbonate films), respectively, 20 times each (round-trip squeezing was counted as 1 time), to finally complete the preparation of R+T/Lipo/EXO.
Morphology, Particle Size, and Potential of Nano Complexes
The morphology of R+T/Lipo and R+T/Lipo/EXO was observed using TEM. The particle size distribution, PDI, and potential of the nano complexes were measured using a Zetasizer Lab nanoparticle size potentiostat measuring instrument.
In vitro Release of Nano Complexes
The excitation light and emission light of rhubarbic acid 75% ethanol aqueous solution, tanshinone IIA sodium sulfonate aqueous solution, and R+T/Lipo were detected using an enzyme marker with quartz cuvette.
Precisely weigh 1 mg of rheinic acid and 5 mg of sodium tanshinone IIA sulfonate and dissolve them together in 10 mL of PBS to obtain an R+T solution with a concentration of 0.6 mg/mL. 100 μL of R+T/Lipo, R+T/Lipo/EXO, and R+T solutions were taken and put into a dialysis bag with a molecular weight of 10,000 Da, and the solution outside the bag was 30 mL PBS, and the above drugs were put into a 37°C thermostat and shaken. At 0.5 h, 1 h, 2 h, 4 h, 8 h, 10 h, 24 h, 48 h, and 72 h, 1 mL of liquid outside the dialysis bag was removed and 1 mL of new PBS was added. The amount of liquid R+T removed at each hour was measured by an enzyme marker.
Stability Observation of Nano Complexes
The liquid properties of the four drugs, R+T/Lipo, R+T/Lipo/EXO, were photographed on day 1, day 7, day 30, and day 90, respectively, to observe whether there was precipitation.
R+T/Lipo, R+T/Lipo/EXO Labeled with Cy3 and Cy5
Known particle numbers of R+T/Lipo and R+T/Lipo/EXO were added at a ratio of 50 Cy5 NHS per particle, stirred for 24 h, washed three times by ultrafiltration with a 30 kDa ultrafiltration membrane (centrifuged at 12,000 g for 10 min), and then dispersed again with pure water. The final concentrations of Cy5-R+T/Lipo and Cy5-R+T/Lipo/EXO were allowed to be approximately 2mg/mL. Cy3-R+T/Lipo and Cy3-R+T/Lipo/EXO were prepared as described above.
Cellular Pharmacodynamic Experiments
Cell Culture
Mouse monocyte-macrophage leukemia cells (leukemia cells in mouse macrophage) Raw264.7, purchased from Wuhan Pronosai Life Sciences Co. The cells were incubated with high sugar DMEM medium (containing 100 U/mL each of penicillin and streptomycin) containing 10% fetal bovine serum (v/v) in an incubator at 37°C in 5% CO2 environment, and the cells were digested and passaged with PBS.
Pharmacodynamic Study of R+T/Lipo/EXO
To detect the cytotoxicity of R+T/Lipo/EXO on Raw264.7 after LPS stimulation by Cell Counting Kit-8 (CCK-8) assay. Macrophages RAW264.7 in logarithmic growth phase were taken, digested with PBS and inoculated in 96-well culture plates at a cell density of 1×10⁴ cells/well, incubated overnight at 37 °C in CO2 incubator, and after cells being adherent, groups were set: 1 group of normal cells, 1 group of LPS stimulation, 7 groups of LPS stimulation + different concentrations of R+T/Lipo/EXO. According to the group setting, each well was added The final concentrations of the preparations: 80, 60, 30, 15, 7.5, 3.75, 1.625 ug/mL) were incubated for 24 h. After 24 h of incubation, the IC50 was calculated using CCK-8 assay, and the IC50 concentration was used as the intervention concentration of the preparations, and the 96-well plates were inoculated again. Groups: normal group, LPS group, LPS+R+T/Lipo, LPS+R+T/Lipo/EXO, and LPS+R+T, and cell viability was detected by CCK-8.
Cell-Targeting Experiments
Raw264.7 cells were inoculated in 12-well culture plates at a density of 8×10⁴ cells/well after gentle blowing down with PBS and incubated overnight at 37 °C in CO2 incubator, and after the cells were plastered, four groups were set up: Cy5-R+T/Lipo, LPS+Cy5-R+T/Lipo, Cy5-R+T/Lipo/EXO, LPS+Cy5 The cells were first stimulated with LPS for 4 h, then Cy5-R+T/Lipo and Cy5-R+T/Lipo/EXO were added and co-incubated with the cells for 2, 6 and 12 h. The cells were washed three times with PBS, and fixed with 4% paraformaldehyde at room temperature for 20 min, the fixative was discarded, and the cells were washed three times with PBS and photographed by fluorescence inverted microscopy.
Fluorescence
The cells were incubated for 2, 6, and 12 h. The cells were washed three times with PBS, and fixed at room temperature for 20 min with 4% paraformaldehyde, the fixation solution was discarded, the cells were washed three times with PBS, trypsin digested, and the fluorescence intensity was measured by flow cytometry.
Co-Localization of Nanoparticles with Cells
Raw264.7 cells digested with trypsin were inoculated at a density of 8×10⁴ cells/well in confocal tetrad dishes and incubated overnight at 37 °C in a CO2 incubator. After the cells were plastered, two groups were set up: LPS+Cy5-R+T/Lipo, and LPS+Cy5-R+T/Lipo/EXO. +The cells were washed three times with PBS and fixed with 4% paraformaldehyde (room temperature, 20 min), aspirated and discarded, washed three times with PBS, closed with immunofluorescent blocking solution for 1 h at room temperature, discarded, incubated with SCARA3 antibody overnight at 4°C, washed three times with PBS, and incubated with Cy3-labeled goat anti-rabbit secondary antibody for 1 h at room temperature, washed with PBS, stained the nuclei with DAPI, observed under a laser confocal microscope and photographed.
Expression of Inflammatory Factors in vitro
Raw264.7 cells at logarithmic growth stage were taken, digested and inoculated in two 6-well plates at a density of 1×10⁵ cells/well, incubated overnight at 37 °C in CO2 incubator, and after the cells were plastered, the groups were set: normal group, LPS group, LPS+R+T/Lipo, LPS+R+T/Lipo/EXO and LPS+R+T. According to the group settings, each well was added Lipopolysaccharide LPS was stimulated for 4 h, then R+T/Lipo, R+T/Lipo/EXO, and R+T were added and co-incubated with the cells for 48 h. The kits were used to detect TNF-α and IL-6 in the cells.
Apoptosis Protein Assay
Raw264.7 cells at the logarithmic growth stage were taken, digested, and inoculated in two 6-well plates at a density of 1×10⁵ cells/well, and incubated overnight at 37 °C, CO2 incubator. After the cells were plastered, groups were set: normal group, LPS group, LPS+R+T/Lipo, LPS+R+T/Lipo/EXO, and LPS+R+T, and co-incubated with the cells for 48 h. Western Blot was used to detect the protein expression of Bax, Bak, Cyt C, Apaf-1, Caspase-9, and Caspase-3.
Flow Cytometric Detection of Apoptosis
Raw264.7 cells at the logarithmic growth stage were digested, inoculated in 12-well plates at a density of 1×10⁵ cells/well, and incubated overnight at 37 °C in a CO2 incubator. After the cells were plastered, groups were set: normal group, LPS group, LPS+R+T/Lipo, LPS+R+T/Lipo/EXO, and LPS+R+T, and co-incubated with the cells for 48 h. The Annexin V-FITC assay kit was used to detect the anti-apoptotic effect of the nanocomplex.
Animal Pharmacodynamic Experiments
Animals and Ethics
Balb/c male mice (6 ~ 8 weeks, 18 ~ 22 g)) were obtained from Zhejiang Medical Animal Center (Hangzhou, China). All mice were housed individually in specific pathogen-free conditions with free access to sterile water and feed. The ambient temperature was between 22–25°C, humidity was 60%, and light/dark cycle time was 12 h. Animal protocols were performed in strict accordance with the National Guidelines for the Use of Research Animals (China) and approved by the Ethics Committee of Shanghai University of Traditional Chinese Medicine (PZSHUTCM2303020004).
Efficacy of Nanoparticles in Mice
Fifty male Balb/c mice were randomly divided into 5 groups: normal group (n=10), model group (n=10), R+T/Lipo group (n=10), R+T/Lipo/EXO group (n=10), and R+T (DMSO) group (n=10). Mice in the model group were injected intraperitoneally with LPS and administered 6 h after modeling. Except for the normal group, all the groups were administered as the model group, and all were administered 200 μL. All groups were administered caudal vein except R+T (DMSO) group which was injected intraperitoneally, and 48 h after administration, fecal samples were taken, followed by blood collection from the heart after anesthesia.
Histopathological analysis. The heart, liver, spleen, lung, ileum, and kidney tissues of mice were fixed in 4.5% formalin buffer and embedded in paraffin.
To detect inflammatory factors and antioxidant activity. Enzyme-linked immunosorbent assay was used to detect the levels of TNF-α and IL-6 in renal and colonic tissues.
Safety Testing of Nano Complexes
Hemolysis test: Preparation of 2% erythrocyte suspension: 1 mL of blood from healthy mice was taken and put into an anticoagulation tube, which was inverted up and down to prevent coagulation. Then add 5 mL of 0.9% sodium chloride solution to the anticoagulation tube, mix thoroughly, and centrifuge at 1000 rpm for 15 min, carefully remove the supernatant using a pipette gun. The supernatant was carefully removed using a pipette. Repeat three times so that the supernatant no longer appears red, and continue washing if red appears. Finally, the obtained erythrocytes were prepared into a 2% suspension with 0.9% NaCl solution in the ratio of 2 mL of erythrocytes + 98 mL of 0.9% NaCl solution for subsequent experiments.
After taking n Ep tubes, respectively numbered 1234., where No. 1 is a negative control tube, No. 2 test tube is a positive control tube and No. 3 reagent tube is a sample solution tube (no red blood cell suspension, samples are: R+T/Lipo, R+T/Lipo/EXO, respectively), and No. 4 test tube as a sample + red blood cell tube. Then 2% erythrocyte suspension, 0.9% NaCl solution, and distilled water were added sequentially according to the grouping. The tubes were centrifuged at 8000 rpm for 5 min and the hemolysis of each tube was recorded. The supernatant was then taken and the absorbance of the supernatant at 541 nm was measured.
Liver and kidney function indicators were examined. Serum alanine aminotransferase (ALT) and aspartate aminotransferase (AST) were measured to evaluate liver function. Renal function was evaluated by measuring serum creatinine (SCr) and urea nitrogen (BUN).
Routine blood test. The changes in white blood cells (WBC), red blood cells (RBC), hemoglobin (HGB), and platelets (PLT) in whole blood routine of mice were measured to observe the inflammation status and safety of nanocomplexes in mice.
Detection of Intestinal Flora in Mice
Five groups of mice, normal group, model group, R+T/Lipo group, R+T/Lipo/EXO group, and R+T (DMSO) group, were placed in sterile beakers and feces were collected with sterilized forceps after defecation. Ten EP tubes were placed in each group, and each group was filled with 2–3 fecal samples. The sample traits were observed, and after taking pictures of each group, the samples were immediately stored frozen in a refrigerator at −80°C and then used for intestinal flora diversity analysis.
Statistical Analysis
Routine Statistical Analysis
The quantitative results of this study were expressed as mean ± standard deviation mean ± s.d. The experimental data were statistically analyzed using SPSS 26.0, and the differences between groups were analyzed using one-way ANOVA (one-way analysis of variance), and significant differences were considered at p < 0.05.
Analysis of Intestinal Flora
- Alpha diversity analysis: alpha diversity indices Chaol, goods coverage, observed species, PD whole tree, Simpson, Shannon were used to assess the diversity and richness of the sample flora, and the significance test was performed on the alpha diversity indices of the two groups. If P < 0.05, it was considered that there were intergroup differences in the diversity and richness of the flora.
- Beta diversity analysis: Principal Co-ordinates Analysis (PCoA) based on the Bray-Curtis distance matrix algorithm was used to demonstrate the differences in colony community composition between samples. Beta diversity was used and the two principal coordinates with the greatest degree of explanation for the differences between samples were selected as the horizontal coordinates (PC1) and vertical coordinates (PC2) were used for graphing to visualize the similarities and differences between samples.
- Differential bacteria screening: differential flora screening was performed using LEFSE analysis to find differential species and biomarkers between two or more groups. The main principle is to first detect species with significant differences in abundance between different groups using the non-parametric Kruskal–Wallis rank sum test in multiple groups of samples, then use the significantly different species obtained in the previous step to analyze the differences between groups using the Wilcoxon rank sum test in groups, and finally use Linear Discriminant Finally, Linear Discriminant Analysis (LDA) was used to downscale the data to assess the influence of species with significant differences (ie LDA score), and the threshold value of “LDA > 3.5” was taken to screen the differential populations.
Results
Preparation and Characterization of Formulations
Characterization of H1299 Cell Exosomes
Exosomes are biological particles, ranging in size from 30 to 150 nm, were round or oval, wrapped in a double membrane and secreted by cells.16 Exosomes are involved in intercellular communication, interact with receptors on the surface of target cells, and regulate specific signals. Exosomes participate in intercellular communication, interact with receptors on the surface of target cells, and regulate specific signaling pathways.17 Tumor exosomes have been shown to alter the phenotype of macrophages, promote macrophage polarization, and have good anti-inflammatory effects.12 In addition to pre-treating the tumor microenvironment with cytotoxic chemokines to reduce metastasis, exosomes can also be used as an effective drug delivery system.11 The particle number of EXO was (2.63±0.31) × 1012 as measured by the particle size meter. The particle size was about 108.37±9.22 nm (Figure 1a), which was consistent with the size of exosomes. The TEM (Figure 1b) showed the saucer-like morphology of exosomes with a slightly brighter ring around the edge, and the particle size was about 100 nm, which was consistent with the exosome morphology.
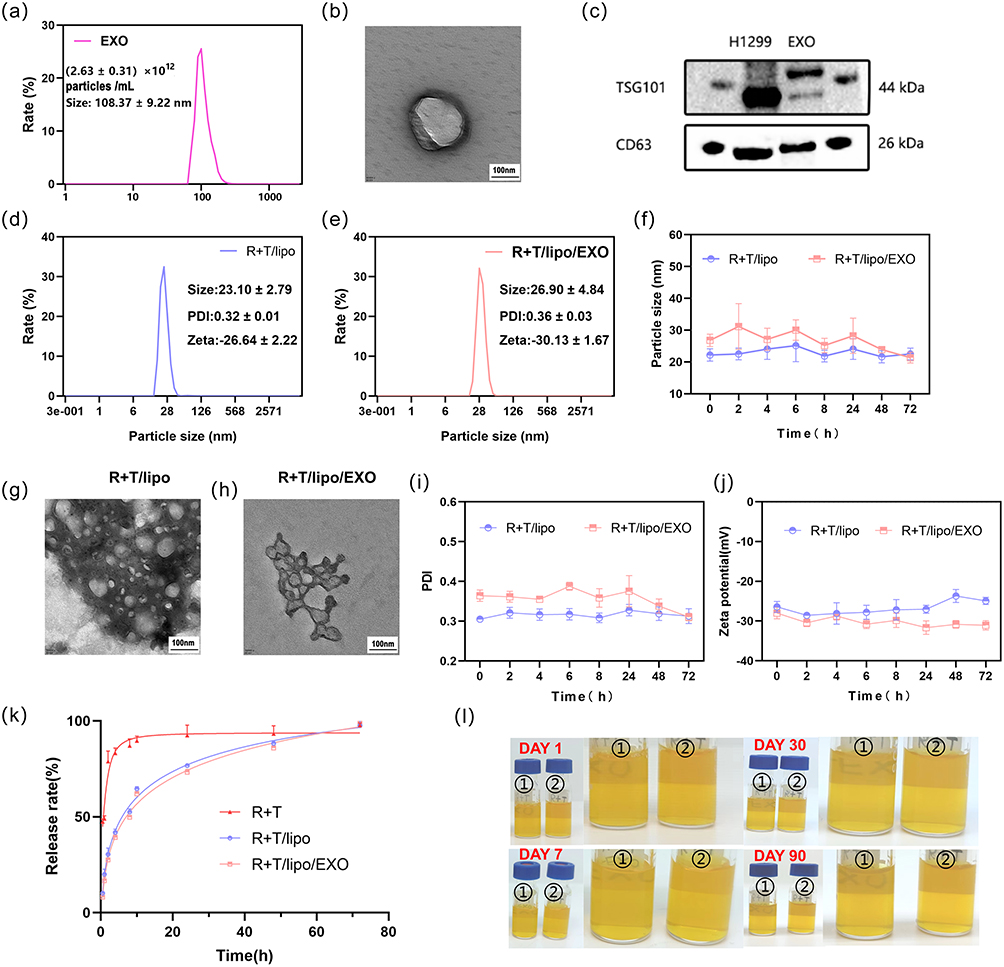 |
Figure 1 (a) the number and size of exocrine particles; (b) morphology of exocrine under TEM. (c) protein expression of exocrine in western-blot. (d) the particle size of R+T/lipo; (e) the particle size of R+T/lipo/EXO; (f) particle size changes of two kinds of nanoparticles within 72 h; (g) morphology of R+T/lipo under TEM; (h) morphology of R+T/lipo/EXO under TEM; (i) PDI changes of two kinds of nanoparticles within 72 h; (j) zeta changes of two kinds of nanoparticles within 72 h; (k) release curves of three drugs; (l) stability of nanocomposites in 90 days. |
Among the specific proteins expressed by exosomes, the top 4 assays were CD63, TSG101, CD9, and CD81.18 In this study, we detected the expression of CD63 and TSG101 proteins in H1299 cells and extracted EXO by WB. As shown in Figure 1c, the extracted EXO specifically expressed CD63 and TSG101 proteins. The TSG101 protein bands of H1299 and EXO in Figure 1c are not at the same level due to partial degradation of EXO. The particle size and morphology of EXO, combined with the specific proteins expressed by EXO, confirmed that the products obtained from the supernatant of H1299 cells were exosomes.
Morphology, Particle Size, and Potential of Nano Complexes
The products were examined by Zetasizer Lab nanoparticle size potentiostat, as shown in Figure 1d and e, and the particle sizes of R+T/Lipo and R+T/Lipo/EXO were 23.10 ± 2.79 nm and 26.90 ± 4.84 nm, respectively. After 72 h observation (Figure 1f), it was found that the particle size did not change significantly, suggesting that the nanocomplexes were stable for 72 h. Under TEM, R+T/Lipo was seen to be disc-like with a particle size of around 20 nm, while R+T/Lipo/EXO was circular with a particle size close to 30 nm (Figure 1g and h), which was consistent with the dynamic light scattering results. after EXO wrapping the nanoparticles, the pro-liposomes were seen to increase significantly. Comparing Figure 1a and e, it can be seen that the original EXO was larger during the experiment and decreased after loading because we squeezed the exosomes during the loading of liposomes, so the size became smaller compared to the original exosomes.
After 72h PDI assay, the best R+T/Lipo homogeneity and poor R+T/Lipo/EXO homogeneity were seen (Figure 1i). It is considered to be related to the homogeneity of exosome wrapping.
After 72 h zeta assay, as seen by (Figure 1j), the R+T/Lipo and R+T/Lipo/EXO charges were −26.64 ± 2.22, and −30.13 ± 1.67, in that order. the exosome surface carries a negative charge of phosphatidylserine (PS),19 so the potential of R+T/Lipo was higher than that of R+T/Lipo/EXO, and the potential change was as expected.
In vitro Release of Nano Complexes
The in vitro release kinetics of R+T were investigated by dialysis, and the release curves (Figure 1k) were obtained by enzymatic standard assay of R+T/Lipo, R+T/Lipo/EXO, and R+T at Ex460 nm, Em 625 nm. As shown in the figures, free R+T was rapidly released up to 80% within the first 10 h and completely released within 24 h. Compared with free R+T, the release of R+T/Lipo and R+T/Lipo/EXO was relatively slow, with 50% release in the first 10 h, 70% release in 24 h, and complete release in 72 h. It is suggested that the nanocomplexes have the advantage of stable release. In addition, the release curves of R+T/Lipo and R+T/Lipo/EXO exhibit a high degree of similarity due to their shared phospholipid composition and comparable drug delivery patterns. However, we opted for R+T/Lipo/EXO as it capitalizes on the remarkable selectivity of tumor exosomes towards inflammatory cells and environments, thereby enabling more efficient targeting of inflammatory sites. Consequently, R+T/Lipo/EXO was selected.
Stability of Nano Complexes
The properties of the four nano complexes were observed at 1 day, 7 days after storage for 30 days and 90 days, respectively, and it was observed that the color and permeability of these four drugs did not change significantly between day 1 and day 90, and no significant particle deposition was observed, which implies good drug stability (Figure 1l).
In vitro Studies of Nano Complexes
Pharmacodynamic Study of Nano Complexes
The cell survival rates of the normal group, LPS group, LPS+R+T/Lipo, LPS+R+T/Lipo/EXO, and LPS+R+T were compared at the same drug concentration (R+T concentration of 15 μg/mL). The results showed that the cell survival rate was significantly reduced to 50–60% in the LPS group compared to the normal group (Figure S1). Cell survival rates were significantly higher in the LPS+R+T/Lipo, LPS+R+T/Lipo/EXO, and LPS+R+T groups compared to the LPS group. cell survival rates were more similar for LPS+R+T/Lipo and LPS+R+T/Lipo/EXO, both around 85–90% and slightly higher for the free drug R+T group (90–100%). The survival rate of the free drug R+T group (90–100%) was slightly higher than that of the four nano-drugs, which was considered to be related to the ease of entry of drug monomers into cells. In conclusion, both free R+T and nano-complexes improved the inflammatory state of cells.
Targeting Studies of Nano Complexes
Cy5-R+T/Lipo and Cy5-R+T/Lipo/EXO were prepared by labeling the nano complexes with Cy5. The cells were first stimulated with LPS for 4 h, and then treated with Cy5-labeled nano complexes for 2 h, 6 h, and 12 h, respectively, after modeling, and the uptake of nano complexes by Raw264.7 cells was observed under a fluorescence microscope, and the cellular uptake was detected by flow cytometry. intracellular fluorescence intensity. Flow cytometry showed (Figure 2a) that in the R+T/Lipo group, when not stimulated by LPS, the cells uptake the drug slower, with less uptake in 2h, gradually increasing in 6h, and the uptake reached the highest after 12h, while in the inflammatory state, the cells uptake increased faster than before, maintaining high uptake in 2–6h, and the uptake decreased significantly in 12h. In the R+T/Lipo/EXO group, when not stimulated by LPS, the cells sustained a steady uptake of the drug from 2–6h, with a decrease in uptake at 12h, whereas in the inflammatory state, the cellular uptake was slower than before, with the fastest uptake at 2h, and a decrease in uptake at 6h.
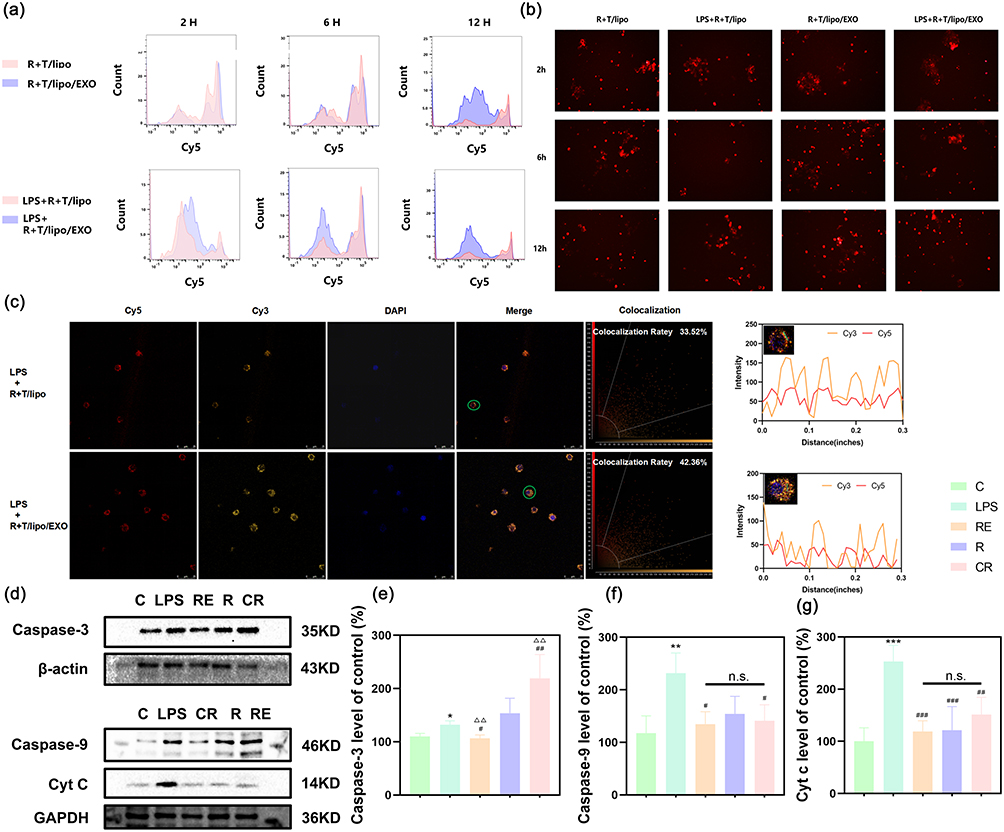 |
Figure 2 (a) detection of fluorescence expression of R+T/lipo and R+T/lipo/EXO before and after LPS stimulation by flow cytometry within 12 h; (b) detection of fluorescence expression of R+T/lipo/EXO before and after LPS stimulation by flow cytometry within 12 h; (c) cellular uptake of cy5-R+T/lipo and cy5-R+T/lipo/EXO under fluorescence microscope within 12 h; co-localization imaging of nano-drugs and cells; (d) effects of nanocomposites on apoptosis-related proteins by Western blot; (e) changes of Caspase-3 protein expression (compared with the normal group, *P<0.05; compared with the LPS group, #P<0.05, ##P<0.01; compared with the R+T/lipo group, ΔΔP<0.01) (C: Control group; LPS: LPS group; R: LPS+R+T/Lipo group; RE: LPS+R+T/Lipo/EXO group; CR: LPS+R+T group); (f) changes of Caspase-9 protein expression (compared with the normal group, **P<0.01; compared with the LPS group, #P<0.05; n.s. no statistical difference) (C: Control group; LPS: LPS group; R: LPS+R+T/Lipo group; RE: LPS+R+T/Lipo/EXO group; CR: LPS+R+T group); (g) changes of Cyt C protein expression (compared with the normal group, ***P<0.001; compared with the LPS group, ##P<0.01, ###P<0.001; n.s. no statistical difference. C: Control group; LPS: LPS group; R: LPS+R+T/Lipo group; RE: LPS+R+T/Lipo/EXO group; CR: LPS+R+T group). |
As shown by the above differences, the uptake of nanoparticles was significantly increased after LPS stimulation; with or without LPS stimulation, there was a faster uptake in the R+T/Lipo/EXO group in the first 2h. The above results suggested that the cellular uptake rate of the drug in the R+T/Lipo/EXO group was higher than that in the R+T/Lipo group.
Fluorescence microscopy (Figure 2b): as seen in the figures, after the drug entered the cells, the peripheral fluorescence was weakened, and the intracellular fluorescence was visible obviously. Based on the changes in peripheral and intracellular fluorescence intensity, the results were the same as flow cytometry.
Co-Localization Study of Nano Complexes
SCARA3, also known as macrophage scavenger receptor (MSR), is a membrane glycoprotein present in macrophages.20 Numerous studies have shown that SCARA3 has a wide range of ligand-binding activities, including modified lipoproteins, maleated bovine serum albumin (M-BSA), polyinosinic monophosphatidic acid, serine phospholipids, some polysaccharides and bacterial lipopolysaccharides.21 To study the interaction of the nanopreparations with SCARA3, Cy3-labeled antibodies were used to recognize the SCARA3 receptor on the surface of Raw264.7 cells. After stimulation with LPS for 4h, cells were treated with Cy5-R+T/Lipo and Cy5-R+T/Lipo/EXO and then analyzed for co-localization after co-incubation with the SCARA3 antibody. The results showed that the co-localization rates of R+T/Lipo and R+T/Lipo/EXO were 33.52% and 42.36%, respectively, as shown in Figure 2c. Based on the confocal imaging and fluorescence intensity results, it is seen that the targeting ability of R+T/Lipo/EXO is stronger than that of R+T/Lipo.
Expression of Inflammatory Factors in Nano Complexes
Macrophages are capable of producing pro-inflammatory cytokines and inducing apoptosis.22–24 In this study, the anti-inflammatory ability of nanocomplexes was assessed by detecting the expression of cellular inflammatory factors IL-6 and TNF-α. The results showed that the expression levels of IL-6 and TNF-α in the LPS group were significantly higher than those in the normal group after 48 h of modeling, which were approximately 2.5 and 1.5 times higher than those in the normal group, with statistically significant differences. After treatment with R+T/Lipo/EXO, R+T/Lipo and R+T (DMSO), IL-6 and TNF-α were decreased, and there was no significant difference between the three groups, in IL-6, about 0.65 times of the LPS group; TNF-α decreased more, about 0.56 times of the LPS group. The above results (Figures S2 and S3) suggest that both nanopreparations had better anti-inflammatory effects at the cellular level, but exosome-loaded liposomes did not reduce inflammatory factors better than the liposomal nanopreparation group alone.
Effect of Nano Complexes on Apoptosis-Associated Proteins
In the mitochondrial apoptotic pathway, Cyt C, Caspase-9, and Caspase-3 play important roles.5,6,25 In this study, intracellular expression of Cyt C, Caspase-9, and Caspase-3 was measured by WB, and the results are shown in Figure 2d–g. Compared with normal cells, the expression of apoptosis-related proteins was significantly increased in LPS-stimulated cells; treated with R+T/Lipo, R+T/Lipo/EXO and R+T (DMSO) cells, the expression of intracellular Cyt C, Caspase-9, and Caspase-3 was significantly inhibited, and the best inhibition effect was observed in the R+T/Lipo/EXO group, indicating that R+T/Lipo/EXO has good anti-apoptotic effect.
Flow Cytometry Detection of Apoptosis
Further, the Annexin V-FITC/PI apoptosis detection kit was used to quantify apoptotic cells. The fluorescent probe FITC-labeled Annexin V binds to phosphatidylserine that exfoliates to the cell surface of early apoptotic cells, showing green fluorescence; propidium iodide (PI) stains cells that have lost cell membrane integrity, ie, necrotic or late apoptotic cells show red fluorescence. The results of the direct detection of the stained cells by flow cytometry are shown in Figure S4a and b. 45.28±5.50% of the cells underwent apoptosis after LPS stimulation, while the percentage of apoptotic cells produced by LPS stimulation decreased significantly after R+T/LipoH and R+T/Lipo/EXO treatments, to 14.21±0.73% and 17.79±1.76%. This result demonstrated the good anti-apoptotic ability of both nano complexes.
In vivo Studies of Nano Complexes
Anti-Inflammatory Effect of Nano Complexes
In this study, the anti-inflammatory ability of NPs was further assessed by determining the levels of pro-inflammatory cytokines (IL-6 and TNF-α) in the serum of mice The results were seen in the mouse LPS-stimulated model of sepsis, and after 48 h of modeling, as shown in Figure 3a and b, the expression levels of IL-6 and TNF-α in the LPS group were significantly higher than those in the normal group, which were about 1.5 and 1.78 times higher than those in the normal group. Compared with the R+T (DMSO) group, both nano-agent treatments significantly reduced the expression of the inflammatory factors IL-6 and TNF-α, with the R+T/Lipo/EXO group showing the greatest decrease, approximately 0.56 and 0.5 times that of the LPS group, which was close to the level of the inflammatory factors in the normal group, and had the optimal effect of improving inflammation. The R+T/Lipo/EXO group had a significantly better effect in reducing the TNF-α was significantly better than that of the R+T/Lipo group, but there was no significant difference in the expression of IL-6. The above results suggest that the in vivo study demonstrated that the two nano-formulations were significantly more effective in reducing the expression of inflammatory factors than the R+T group, while the R+T/Lipo/EXO was most effective in reducing the inflammatory factor TNF-α.
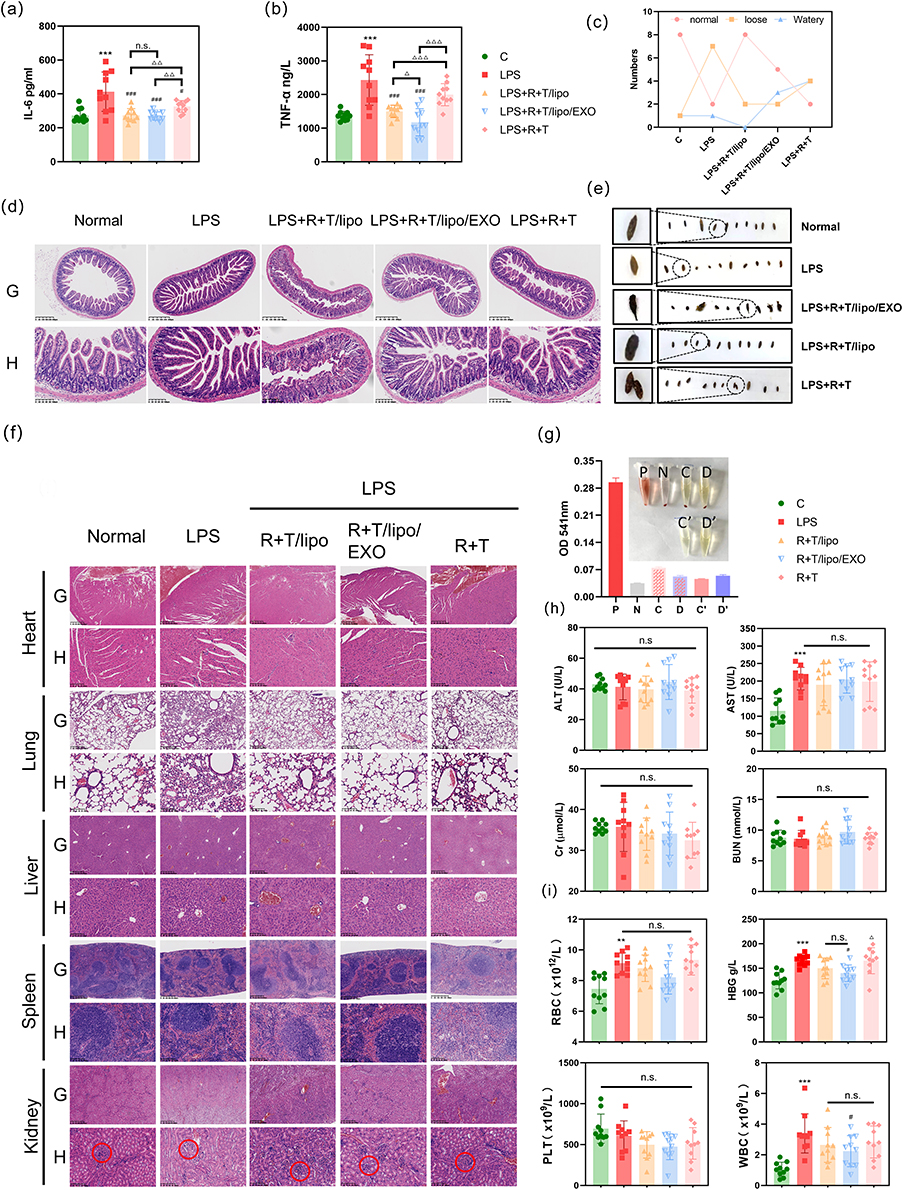 |
Figure 3 (a) effects of nanocomposites on IL-6 in mice (compared with the normal group, ***P<0.001; compared with the LPS group, #P<0.05, ###P<0.001; n.s. no statistical difference); (b) effects of nanocomposites on TNF-α in mice (compared with the normal group, ***P<0.001; compared with the LPS group, ###P<0.001; compared with the R+T/lipo group, ΔΔΔP<0.001; n.s. no statistical difference); (c) mice fecal characteristics; (d) mice intestinal pathology (G: Scale length: 625 µm, low magnification; H: Scale length: 100 µm, high magnification); (e) mice fecal morphology; (f) pathological changes in various organs of mice (G: Scale length: 625 µm, low magnification; H: Scale length: 100 µm, high magnification; Pathological changes in the glomeruli and tubules are circled in the renal pathology section); (g) hemolysis test of nanocomposites (P: a positive control tube; N: a negative control tube; C: R+T/Lipo + red blood cell tube; D: R+T/Lipo/EXO + red blood cell tube; C’: R+T/Lipo; D’: R+T/Lipo/EXO); (h) effects of nanocomposites on liver and kidney function (compared with the normal group, ***P<0.001; n.s. no statistical difference); (i) effects of nanocomposites on blood (compared with the normal group, **P<0.01, ***P<0.001; compared with the LPS group, #P<0.05; compared with the R+T/lipo group, ΔP<0.05; n.s. no statistical difference). |
Pathological Studies of Various Organs in Mice
Light micrographs of the kidney tissues stained with H & E are shown in Figure 3f. The kidney tissues of mice in the normal group had normal renal structures with obvious brush borders of proximal tubules. tubular necrosis, hyaline casts, and cell abscission were observed in the kidney tissues of mice in the LPS group. After treatment with R+T/Lipo/EXO, R+T/Lipo, and R+T (DMSO), cell abscission and local necrosis were still seen in the kidney tissues of mice in each treatment group, but the damage was significantly reduced compared with the LPS group. The reduction of damage was more obvious in the nanocomplex group, and the brush border of the proximal tubule was well preserved.
Liver pathology showed that the LPS group exhibited different degrees of hepatocyte degeneration in addition to increased inflammatory cells. Compared with the model group, inflammatory cells were reduced and hepatocyte deformation was improved in each nanocomplex group. Histopathological examination of the lung and spleen showed a significant increase in the number of inflammatory cells in the LPS group and a significant decrease in the number of inflammatory cells in the nanocomplex group. Histological examination of the ileum showed (Figure 3c–e) that LPS-induced mice exhibited loss of cup cells, epithelial distortion, severe inflammation, and glandular damage, while treatment attenuated the LPS-induced damage. We collected feces from each group of mice and observed the difference in the number of feces with different textures to assess the effect of treatment in each group of mice. It was observed that the feces of normal mice were formed and were not loose. after LPS stimulation, the feces of mice were significantly increased and were loose or sticky. However, after treatment with R+T/Lipo/EXO, R+T/Lipo, and R+T (DMSO), the mice had significantly less frequent defecations, and their feces were gradually formed and not loose.
Safety of Nano Complexes
The hemolysis test showed that R+T/Lipo and R+T/Lipo/EXO showed no significant hemolysis when incubated with erythrocytes and had good stability (Figure 3g).
Liver and kidney function assay. The levels of Cr, BUN, ALT, and AST in the serum of the mice treated with the preparation were measured (Figure 3h). It was found that AST levels were increased in the LPS group compared to the normal group, while Cr, BUN, and ALT levels did not change significantly. There was a trend of lowering Cr in each treatment group compared to the LPS group, suggesting that the drugs could improve septic kidney injury. In addition, there was no significant increase in BUN, ALT, and AST levels in mice in each treatment group compared with the LPS group, and the nano complexes did not significantly damage the liver and kidney functions, which had a good safety profile.
In the blood routine study (Figure 3i), the WBC in the blood of mice in the LPS group was significantly higher compared to the normal group (WBC: normal group = 1.06 ± 0.46 vs LPS group = 3.41 ± 1.36, P < 0.01), and although the difference between the WBC of each treatment group and the LPS group was not statistically significant, there was a trend of reduction as seen in the figure, suggesting that the drug improved inflammation in mice in vivo. In addition, the nanocomplex had no significant effect on PLT in mice, and the effects on RBC and HGB were the same as those in the LPS group, with no significant increase or decrease, further verifying the biosafety of the nanocomplex.
H & E staining showed that the myocardium of mice was structurally intact with no obvious pathological changes (Figure 3f). In conclusion, there was no effect on blood, liver, or kidney function or myocardial structure, and therefore it has a good safety profile.
Changes in the Richness and Diversity of Microbial Communities
In recent years, an increasing number of experiments have illustrated the interconnection between inflammatory states and changes in intestinal flora.26,27 We collected feces from four groups of mice: normal group (C), LPS group (L), R+T/Lipo/EXO group (RE), and R+T (DMSO) group (CR) for intestinal flora study.
After filtering the raw data and removing non-specific amplification fragments and chimeras, the average number of clean reads obtained per group ranged from 31847 to 74601. The number of OTUs obtained by segmenting all sequences (based on 97% similarity) was 695, attributed to 94 genera. The Venn diagram (Figure 4a) shows a common OTU count of 389 for the four groups and 22, 16, 42, and 44 different OTUs for the four groups C, L, RE, and CR, respectively. The petal plot (Figure S5) shows that there were a total of 40 samples with a core OTU count of 84. Rarefaction curves were constructed by random sampling of the clean readings. The curve tends to be flat, indicating that the number of samples is sufficient (Figure S6). The number of sequences contained in each OTU in a single sample was counted to construct a Rank-abundance curve (rank curve), which was wide and flat, suggesting high species richness and uniform distribution (Figure S7). PCA (Principal Component Analysis), or principal component analysis, can reveal the complex data hidden behind the simple structure. The percentage of each OTU in each sample is calculated based on the abundance file of each OTU in each sample, and this percentage information is used to perform PCA analysis of OTUs. Principal component analysis PCA (Figure 4b) showed significant differences between group L and group C. The gut microbiota structure was moderated between group L and the groups after applying R+T/Lipo/EXO and R+T (DMSO) (27.58% for PC1).
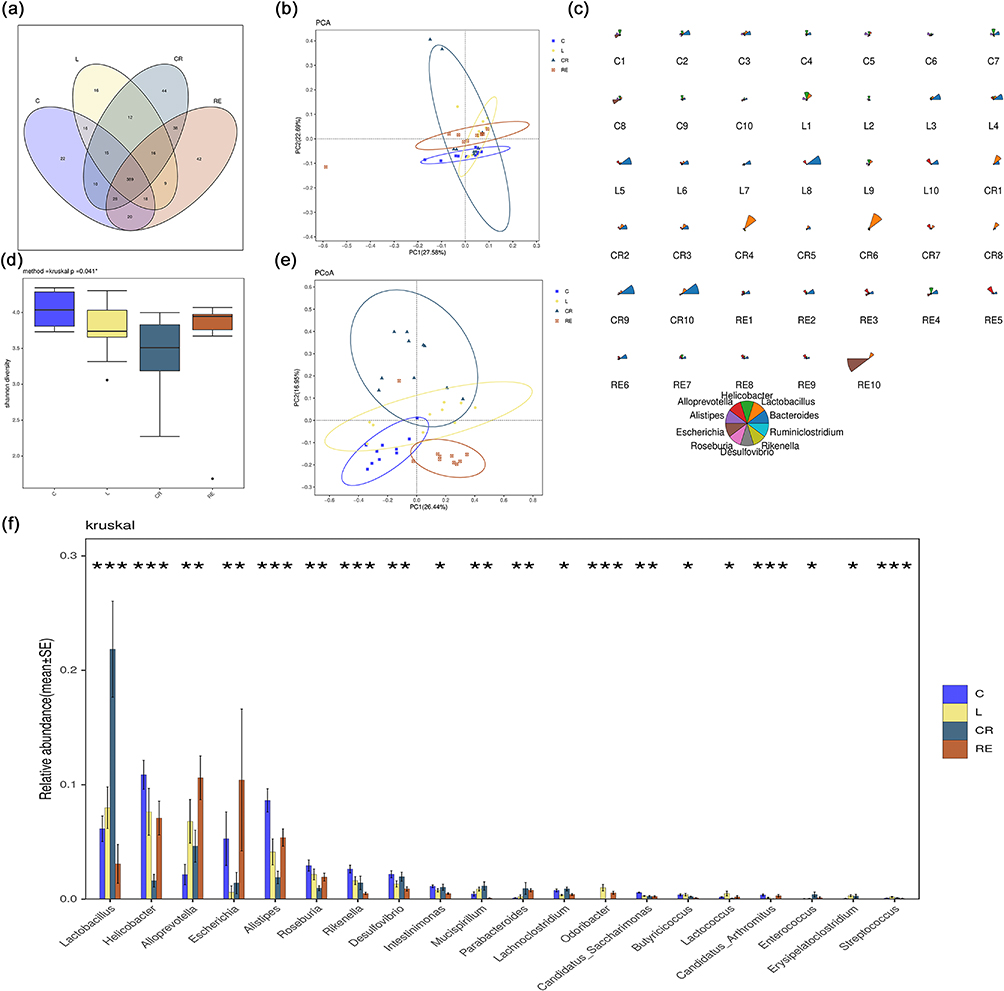 |
Figure 4 Colony richness. (a) Venn diagram of colony grouping; (b) PCA analysis; (c) top 10 abundance of star plots on the genus level; (d) Shannon-Wiener box plots; (e) Beta-Bray Curtis.PCoA; (f) analysis of differences on the genus level. |
In the α-diversity analysis, the Shannon-Wiener curve reflects the microbial diversity of each sample at different sequencing amounts. As shown in Figures 4d.
Shannon-Wiener box plots showed that the diversity of microflora decreased significantly after LPS stimulation and increased significantly after nano-drug treatment, but drug monomer treatment alone could not improve the microflora abundance, even lower than that of the LPS group. Chao index indicates the number of bacteria. Chao index box plot (Figure S8) indicates a significant increase in bacterial count after LPS stimulation, with the RE group showing the most significant increase in bacterial count.
The results of β-diversity analysis (Figure S9) showed that principal coordinates analysis (PCoA, (Figure 4e) based on unweighted UniFrac analysis showed similarity between the four groups C, L, RE, and CR at the OTUS level, with significant differences between the L group and the C group. The overall similarity between the first principal coordinates was restored after the application of drug treatment (PC1 26.44%). the NMDS analysis of UniFrac, the non-metric multidimensional scaling method (NMDS), is a data analysis method that reduces the study objects (samples or variables) in a multidimensional space to a lower dimensional space for localization, analysis, and categorization while preserving the original relationships between the objects. The NMDS (NMDS, (Figure S10) analysis is consistent with the above results. At the genus classification level, Star plots were made for the species abundance of the top 10 genera with the highest abundance. A star plot represents the relative abundance information of species for a sample. The radius of the sector represents the relative abundance of the species, and the longer radius of the sector indicates higher abundance, while the opposite is true for lower abundance. The Star diagram can be seen (Figure 4c). The species richness decreased in the L group, the lowest in the CR group, and increased significantly in the RE group after treatment. The above results show that nanocomposites can improve the diversity of intestinal microorganisms.
Changes in Microbial Community Composition
To further investigate the effect of nano complexes on the composition of the intestinal microbiota, this study was conducted at the genus levels. At the genus level (Figure 4f), the richness of Helicobacter, Escherichia, and Alistipes in group C was significantly higher than that in group L, while the abundance of Lactobacillus and Alloprevotella in group C was significantly lower than that in group L. After CR treatment, except that Lactobacillus and Escherichia increased significantly, the abundance of the other three main bacteria decreased significantly. RE treatment can reduce the abundance of Lactobacillus and Helicobacter, increase the abundance of other bacteria, and make the abundance of bacteria close to that of group C.
Changes in Biomarkers in the Microbial Community
In this study, a branching map at the genus and species level was reconstructed using LEFSE analysis to identify biomarkers that differed significantly in abundance between groups. As shown in (Figure 5), the circle diagram from inside to outside is a cluster tree; the five circles represent the taxonomic levels of phylum, phylum, order, family, and genus from inside to outside. Each small circle on a different circle level represents the taxon at that level, and the diameter of the small circles is proportional to the relative richness of the taxon. At the level of genus, there are 21 different taxonomic branches of abundance with LDA scores >2.0. Lactobacillus, Bacteroides, Helicobacter, Alloprevotella, Escherichia, Alistipes, Roseburia, etc. The abundance of Helicobacter and Alistipes was the highest in the normal group, and the abundance of Acinetobacter increased after LPS stimulation, while the abundance of Lactobacillus was the highest in the CR group. Interestingly, the Prevotellaceae was the most abundant in the RE group (LDA>3.5) (Figure S11).
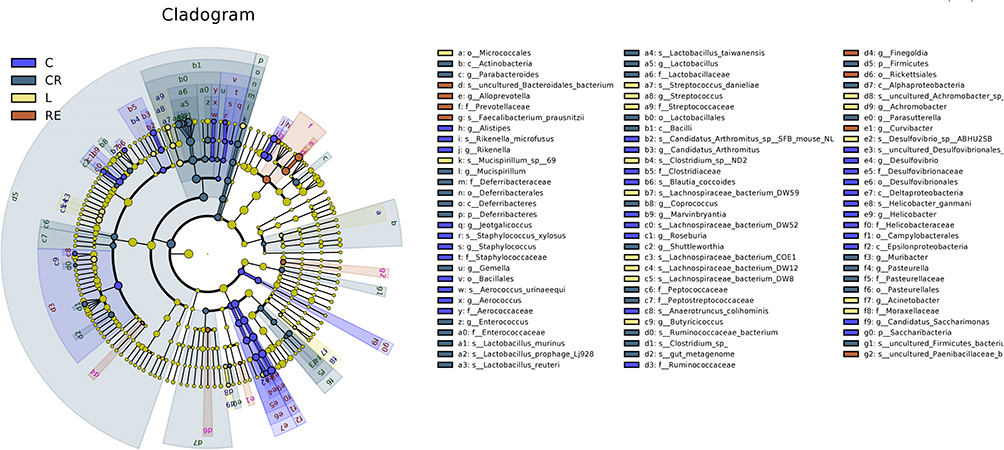 |
Figure 5 The LDA scores of three groups of microorganisms with significant influence were calculated by LDA analysis. |
Discussion
Rhubarb contains numerous active ingredients, and pharmacological research has revealed that its active constituents are primarily quinones, including rhododendrin, rhodolic acid, and rhodol. Among these, rhododendric acid exhibits significant anti-inflammatory, antibacterial, and immunomodulatory properties.28 In particular, rheinic acid demonstrates notable anti-inflammatory and antibacterial effects, along with immunomodulatory activity. Rheinic acid has been shown to substantially increase the expression of interleukin (IL-10) while decreasing the expression of tumor necrosis factor (TNF-α).29 Furthermore, Tanshinone IIA (TSN) is the principal diterpene quinone present in Salvia miltiorrhiza. It exerts diverse pharmacological effects, including antioxidant, anti-inflammatory, antibacterial, antitumor, and hormone-like activities, which make it a valuable therapeutic agent for the aforementioned conditions.7,12,13,29
Apoptosis, a programmed cell death process, can be initiated through two primary pathways.5,30,31 The extrinsic pathway is activated when an inducer binds to a cell surface receptor (eg, Fas), resulting in the subsequent activation of cysteine-aspartic acid protease-8 (caspase-8). The intrinsic pathway, also known as the “mitochondrial” pathway, is triggered by the disruption of the delicate balance between the pro-apoptotic and anti-apoptotic gene products of the B-cell lymphoma 2 (Bcl-2) superfamily and by injurious stimuli induced by cellular stress. This pathway also leads to the activation of caspase-9. Ultimately, both pathways converge to activate caspase-3 and cause DNA fragmentation. Notably, there is an interaction between these two pathways, primarily mediated by truncated Bid (tBid), which is a shortened form of Bcl-2 homologous antagonist/killer (Bid), leading to the release of cytochrome c (Cyt C), endonuclease G, and second mitochondrial activator of caspases (Smac).32,33 Both of these pathways play crucial roles in sepsis-induced apoptosis.25,34,35
The mitochondrial apoptotic pathway is considered both classical and pivotal in apoptotic cell death.6 Upon receiving an apoptotic stimulus, BH3 proteins facilitate the translocation of Bax proteins to the outer mitochondrial membrane, where they oligomerize and form membrane channels. This process triggers the release of cytochrome c (Cyt C) and Smac from the mitochondria into the cytosol. Subsequently, Cyt C associates with Apaf-1, resulting in the formation of apoptosomes and the activation of caspase-9. This cascade of events ultimately leads to the execution of downstream caspase-dependent apoptotic responses, culminating in programmed cell death.36
The Bcl-2 protein family plays a crucial role in regulating apoptosis by modulating mitochondrial permeability. Pro-apoptotic members of the Bcl-2 family, such as Bad, Bid, Bax, and Bim, are initially localized in the cytoplasm. Upon receiving death signals, they translocate to the mitochondria, promoting the release of Cyt C.
In the present study, R+T/Lipo and R+T/Lipo/EXO nanocomplexes were prepared through extrusion and interaction methods, utilizing R+T as the drug and Lipo and EXO as carriers. These nanocomplexes exhibited superior stability and sustained release properties in vivo. In vitro investigations demonstrated that the nanocomplexes significantly enhanced the cell viability of macrophages following stimulation with LPS (lipopolysaccharide). Moreover, macrophages exhibited faster uptake of R+T/Lipo/EXO compared to liposomes alone within 2 hours. Specifically, R+T/Lipo/EXO displayed higher selectivity due to selective binding with SCARA3 receptors on the macrophage surface, while R+T/Lipo exhibited poorer selectivity.
Apoptosis-related protein expression analysis revealed decreased levels of Cytochrome C (Cyt C), Caspase-9, and Caspase-3 upon treatment with the nanocomplexes. Flow cytometry analysis confirmed the induction of apoptosis in inflammatory cells after LPS stimulation, while the nanocomplexes effectively attenuated apoptosis. Furthermore, during inflammation, elevated expression of IL-6 and TNF-α, inflammatory factors, was observed. However, at the cellular level, the nanocomplexes resulted in insignificant reduction of these inflammatory markers.
In conclusion, R+T/Lipo/EXO demonstrated rapid uptake capacity and superior inhibition of apoptosis-related proteins compared to liposome-only nanoparticles. However, both nanocomplexes exhibited similar efficacy in reducing inflammatory factors at the cellular level. The findings suggest that in the treatment of sepsis, the rapid cellular uptake of R+T/Lipo/EXO in the early stages of sepsis could effectively reduce apoptosis, mitigate the inflammatory factor storm, and potentially improve septic conditions. Early administration of more rapid, active, and effective treatments in high-risk patients with acute infections could greatly reduce the incidence of sepsis and the associated morbidity and mortality rates.37
Subsequently, an in vivo study was conducted to assess the effects of the drug. Septic mice induced by LPS exhibited elevated levels of inflammatory factors, which were significantly reduced following a 48-hour drug intervention. Notably, both nanoparticle formulations demonstrated greater efficacy in reducing inflammatory factors compared to the free monomer formulations. Specifically, the R+T/Lipo/EXO group showed superior reduction of TNF-α compared to the liposome nanoparticle group alone, while the effect on reducing IL-6 was comparable between the two formulations. Tumor necrosis factor (TNF) is a class of cytokines with diverse biological effects, including cell growth, differentiation, inflammation, and immune modulation by binding to specific cell membrane receptors. TNF-α, a member of the TNF family, can activate three signaling pathways, namely caspase protease, JNK, and transcription factor NF-kB, to exert its cytotoxic, antiviral, immunomodulatory, and apoptotic effects.38 TNF-α can activate both pro-apoptotic and anti-apoptotic pathways. It can trigger apoptosis through the activation of caspase-8 and −10, while also inhibiting apoptosis through NF-κB, which induces the expression of anti-apoptotic genes such as Bcl-2.37,38 Additionally, cIAP1/2 inhibits TNF-α signaling by binding to TRAF2 and inhibits caspase-8 activation by FLIP.38,39 Based on these mechanisms, it can be inferred that tumor exosome nanopreparations may suppress immune cell apoptosis by modulating TNF-α expression, consequently alleviating sepsis. The observed reduction in IL-6 and TNF-α levels following drug intervention indicates the potential of these nanoparticle formulations in regulating the inflammatory response in sepsis.37
Following LPS stimulation, pathological examination of the mice’s organs revealed varying degrees of inflammatory damage, which were mitigated to varying extents by the treatment with the nano-complexes. Intriguingly, the mice exhibited improvements in fecal characteristics, transitioning from loose to formed stools, accompanied by a gradual reduction in defecation frequency.
In the drug safety evaluation, it was observed that the nanodrug did not induce hemolysis. Furthermore, there were no significant increases in the levels of blood urea nitrogen (BUN), alanine aminotransferase (ALT), and aspartate aminotransferase (AST) in any of the treatment groups compared to the model group. Additionally, a declining trend in creatinine (Cr) levels was observed. Examination of myocardial pathological sections in mice indicated structurally intact myocardium without apparent pathological changes. Collectively, these findings demonstrate that the nano-complexes do not adversely affect blood, liver, or kidney function, nor do they induce myocardial structural alterations, thereby establishing their excellent safety profile.
Lastly, the analysis of mice’s intestinal microbiota revealed noteworthy findings. In the LPS-treated group, the abundance of intestinal microbiota was lower compared to the normal group, whereas all treatment groups exhibited increased abundance after nano-drug treatment. Examination at the genus level indicated significant changes in the composition and markers of the intestinal flora. Specifically, compared to the normal group, Helicobacter, Escherichia, and Alistipes exhibited significant decreases following LPS stimulation, while Lactobacillus and Alloprevotella showed significant increases. The nano-drugs exhibited the capacity to modulate the distribution of intestinal flora, bringing it closer to the normal group. Conversely, the single-drug monomers did not exhibit significant regulatory effects. Notably, after R+T/Lipo/EXO treatment, the abundance of Prevotella and Alistipes increased significantly. Prevotella, a gram-negative bacterium, is non-motile and rod-shaped, existing as single cells under anaerobic conditions. Prevotella demonstrates dual effects on the human body. Some studies have indicated that in mixed infections, Prevotella reduces the expression of Toll-like receptor 4 (TLR-4) and the release of cytokines (IL-6, IL-8) in Pseudomonas aeruginosa by modulating the NF-κB/MAPK signal pathway.40 Alistipes, a gram-negative bacterium of Bacteroides, is a symbiotic bacterium in the intestinal tract. The ecological balance of this bacterium can have both beneficial and detrimental effects. It has been suggested that Alistipes serves a protective role against colitis, and when orally administered to mice, the severity of colitis was similar to that in wild-type mice. Furthermore, co-administration of Alistipes with colitis-inducing bacteria led to significantly reduced colitis severity compared to administration of colitis-inducing bacteria alone, further supporting the colitis-reducing properties of Alistipes.41 Based on these findings, it can be inferred that the nano-complexes have the ability to modulate the community composition of the intestinal flora, particularly by significantly increasing the proportion of probiotic bacteria.
In this study, it was observed that both nano-agents, R+T/Lipo and R+T/Lipo/EXO, exhibited superior ameliorating effects on sepsis. Moreover, the exosome agents demonstrated enhanced targeting capabilities and anti-apoptotic effects on inflammatory cells. However, only in in vivo studies did R+T/Lipo/EXO exhibit better inhibition of TNF-α release compared to R+T/Lipo; its anti-inflammatory advantage was not significant in vitro studies. The insignificance of R+T/Lipo may be attributed to the potential formation of an inflammatory microenvironment by exosomes in vivo. Further exploration is warranted to elucidate the specific mechanism underlying this microenvironment formation. Additionally, although the present study had a shorter duration of action for sepsis treatment, the long-term biosafety profile of tumor exosome agents in organisms remains unclear and requires further investigation.
Conclusion
Overall, R+T/Lipo/EXO effectively inhibits inflammatory cell apoptosis and mitigates gut microbiota disorders, thereby providing potential avenues for clinical sepsis treatment. However, the long-term biosafety of tumour exosomes still requires further attention.
Acknowledgment
This work was supported in part by the Natural Science Foundation of Zhejiang Province (LQ21H300008), Construction of Chinese and Western Medicine Collaborative Response and Intervention Platform for Major Critical Medical Events in Shanghai (ZY2018-2020-FWTX-7005), The fifth batch of “Longyi Scholar” Clinical Scientific and technological Innovation training Project of Longhua Hospital affiliated to Shanghai University of Traditional Chinese Medicine (PY2022011) and Excellent Reserve talents of traditional Chinese Medicine in Shanghai University of traditional Chinese Medicine (2020).
Author Contributions
All authors made a significant contribution to the work reported, whether that is in the conception, study design, execution, acquisition of data, analysis and interpretation, or in all these areas; took part in drafting, revising or critically reviewing the article; gave final approval of the version to be published; have agreed on the journal to which the article has been submitted; and agree to be accountable for all aspects of the work.
Disclosure
The authors declare no conflicts of interest, financial or otherwise in this work.
References
1. Singer M, Deutschman CS, Seymour CW, et al. The third international consensus definitions for sepsis and septic shock (Sepsis-3). JAMA. 2016;315(8):801–810. doi:10.1001/jama.2016.0287
2. Cao C, Yu M, Chai Y. Pathological alteration and therapeutic implications of sepsis-induced immune cell apoptosis. Cell Death Dis. 2019;10(10):782. doi:10.1038/s41419-019-2015-1
3. Rudd KE, Johnson SC, Agesa KM, et al. Global, regional, and national sepsis incidence and mortality, 1990–2017: analysis for the global burden of disease study. Lancet. 2020;395(10219):200–211. doi:10.1016/S0140-6736(19)32989-7
4. Tang G, Luo Y, Lu F, et al. Prediction of sepsis in COVID-19 using laboratory indicators. Front Cell Infect Microbiol. 2020;10:586054. doi:10.3389/fcimb.2020.586054
5. Cohen JJ, Duke RC, Fadok VA, Sellins KS. Apoptosis and programmed cell death in immunity. Annu Rev Immunol. 1992;10:267–293. doi:10.1146/annurev.iy.10.040192.001411
6. Estaquier J, Vallette F, Vayssiere JL, Mignotte B. The mitochondrial pathways of apoptosis. Adv Exp Med Biol. 2012;942:157–183. doi:10.1007/978-94-007-2869-1_7
7. Huang X, Deng H, Shen QK, Quan ZS. Tanshinone IIA: pharmacology, total synthesis, and progress in structure-modifications. Curr Med Chem. 2022;29(11):1959–1989. doi:10.2174/0929867328666211108110025
8. Gao H, He C, Hua R, et al. Underlying beneficial effects of Rhubarb on constipation-induced inflammation, disorder of gut microbiome and metabolism. Front Pharmacol. 2022;13:1048134. doi:10.3389/fphar.2022.1048134
9. Xu M, Cao FL, Zhang YF, et al. Tanshinone IIA therapeutically reduces LPS-induced acute lung injury by inhibiting inflammation and apoptosis in mice. Acta Pharmacol Sin. 2015;36(2):179–187. doi:10.1038/aps.2014.112
10. Wang W, Zhu N, Yan T, et al. The crosstalk: exosomes and lipid metabolism. Cell Commun Signal. 2020;18(1):119. doi:10.1186/s12964-020-00581-2
11. Liang M, Chen X, Wang L, et al. Cancer-derived exosomal TRIM59 regulates macrophage NLRP3 inflammasome activation to promote lung cancer progression. J Exp Clin Cancer Res. 2020;39(1):176. doi:10.1186/s13046-020-01688-7
12. Baig MS, Roy A, Rajpoot S, et al. Tumor-derived exosomes in the regulation of macrophage polarization. Inflamm Res. 2020;69(5):435–451. doi:10.1007/s00011-020-01318-0
13. Liu Y, Kuang D, Li D, et al. Roles of the gut microbiota in severe SARS-CoV-2 infection. Cytokine Growth Factor Rev. 2022;63:98–107. doi:10.1016/j.cytogfr.2022.01.007
14. Poon W, Zhang YN, Ouyang B, et al. Elimination pathways of nanoparticles. ACS Nano. 2019;13(5):5785–5798. doi:10.1021/acsnano.9b01383
15. Zhang M, Tahara Y, Yang M, Zhou X, Iijima S, Yudasaka M. Quantification of whole body and excreted carbon nanohorns intravenously injected into mice. Adv Healthc Mater. 2014;3(2):239–244. doi:10.1002/adhm.201300192
16. Cufaro MC, Pieragostino D, Lanuti P, et al. Extracellular vesicles and their potential use in monitoring cancer progression and therapy: the contribution of proteomics. J Oncol. 2019;2019:1639854. doi:10.1155/2019/1639854
17. Corrado C, Raimondo S, Chiesi A, Ciccia F, De Leo G, Alessandro R. Exosomes as intercellular signaling organelles involved in health and disease: basic science and clinical applications. Int J Mol Sci. 2013;14(3):5338–5366. doi:10.3390/ijms14035338
18. Greening DW, Xu R, Ji H, Tauro BJ, Simpson RJ. A protocol for exosome isolation and characterization: evaluation of ultracentrifugation, density-gradient separation, and immunoaffinity capture methods. Methods Mol Biol. 2015;1295:179–209. doi:10.1007/978-1-4939-2550-6_15
19. Matsumoto A, Takahashi Y, Nishikawa M, et al. Role of phosphatidylserine-derived negative surface charges in the recognition and uptake of intravenously injected B16BL6-derived exosomes by macrophages. J Pharm Sci. 2017;106(1):168–175. doi:10.1016/j.xphs.2016.07.022
20. Whelan FJ, Yap NV, Surette MG, Golding GB, Bowdish DM. A guide to bioinformatics for immunologists. Front Immunol. 2013;4:416. doi:10.3389/fimmu.2013.00416
21. Cheng C, Zheng E, Yu B, et al. Recognition of lipoproteins by scavenger receptor class A members. J Biol Chem. 2021;297(2):100948. doi:10.1016/j.jbc.2021.100948
22. Li C, Wang W, Xie SS, et al. The programmed cell death of macrophages, endothelial cells, and tubular epithelial cells in sepsis-AKI. Front Med. 2021;8:796724. doi:10.3389/fmed.2021.796724
23. Li Z, Jia Y, Feng Y, et al. Methane alleviates sepsis-induced injury by inhibiting pyroptosis and apoptosis: in vivo and in vitro experiments. Aging. 2019;11(4):1226–1239. doi:10.18632/aging.101831
24. Robinson N, Ganesan R, Hegedűs C, Kovács K, Kufer TA, Virág L. Programmed necrotic cell death of macrophages: focus on pyroptosis, necroptosis, and parthanatos. Redox Biol. 2019;26:101239. doi:10.1016/j.redox.2019.101239
25. Ayala A, Perl M, Venet F, Lomas-Neira J, Swan R, Chung CS. Apoptosis in sepsis: mechanisms, clinical impact and potential therapeutic targets. Curr Pharm Des. 2008;14(19):1853–1859. doi:10.2174/138161208784980617
26. Banerjee A, Herring CA, Chen B, et al. Succinate produced by intestinal microbes promotes specification of tuft cells to suppress ileal inflammation. Gastroenterology. 2020;159(6):2101–2115e2105. doi:10.1053/j.gastro.2020.08.029
27. Becattini S, Sorbara MT, Kim SG, et al. Rapid transcriptional and metabolic adaptation of intestinal microbes to host immune activation. Cell Host Microbe. 2021;29(3):378–393e375. doi:10.1016/j.chom.2021.01.003
28. Sha H, Gu Y, Shen W, et al. Rheinic acid ameliorates radiation-induced acute enteritis in rats through PPAR-γ/NF-κB. Genes Genomics. 2019;41(8):909–917. doi:10.1007/s13258-019-00824-8
29. Lin CF, Chuang SY, Huang TH, et al. A systematic comparison of the effect of topically applied anthraquinone aglycones to relieve psoriasiform lesion: the evaluation of percutaneous absorption and anti-inflammatory potency. Biomed Pharmacother. 2022;145:112482. doi:10.1016/j.biopha.2021.112482
30. Kerr JF, Wyllie AH, Currie AR. Apoptosis: a basic biological phenomenon with wide-ranging implications in tissue kinetics. Br J Cancer. 1972;26(4):239–257. doi:10.1038/bjc.1972.33
31. Alison MR, Sarraf CE. Apoptosis: a gene-directed programme of cell death. J R Coll Physicians Lond. 1992;26(1):25–35. PMCID: PMC5375407.
32. Madesh M, Antonsson B, Srinivasula SM, Alnemri ES, Hajnóczky G. Rapid kinetics of tBid-induced cytochrome c and Smac/DIABLO release and mitochondrial depolarization. J Biol Chem. 2002;277(7):5651–5659. doi:10.1074/jbc.M108171200
33. van Loo G, Schotte P, Van Gurp M, et al. Endonuclease G: a mitochondrial protein released in apoptosis and involved in caspase-independent DNA degradation. Cell Death Differ. 2001;8(12):1136–1142. doi:10.1038/sj.cdd.4400944
34. Hotchkiss RS, Osmon SB, Chang KC, Wagner TH, Coopersmith CM, Karl IE. Accelerated lymphocyte death in sepsis occurs by both the death receptor and mitochondrial pathways. J Immunol. 2005;174(8):5110–5118. doi:10.4049/jimmunol.174.8.5110
35. Chang KC, Unsinger J, Davis CG, et al. Multiple triggers of cell death in sepsis: death receptor and mitochondrial-mediated apoptosis. FASEB J. 2007;21(3):708–719. doi:10.1096/fj.06-6805com
36. Li P, Nijhawan D, Budihardjo I, et al. Cytochrome c and dATP-dependent formation of Apaf-1/caspase-9 complex initiates an apoptotic protease cascade. Cell. 1997;91(4):479–489. doi:10.1016/S0092-8674(00)80434-1
37. Yan J, Xiang J, Lin Y, et al. Inactivation of BAD by IKK inhibits TNFα-induced apoptosis independently of NF-κB activation. Cell. 2013;152(1–2):304–315. doi:10.1016/j.cell.2012.12.021
38. Ouyang L, Shi Z, Zhao S, et al. Programmed cell death pathways in cancer: a review of apoptosis, autophagy, and programmed necrosis. Cell Prolif. 2012;45(6):487–498. doi:10.1111/j.1365-2184.2012.00845.x
39. Ichim G, Tait SW. A fate worse than death: apoptosis as an oncogenic process. Nat Rev Cancer. 2016;16(8):539–548. doi:10.1038/nrc.2016.58
40. Bertelsen A, Elborn JS, Schock BC. Microbial interaction: prevotella spp. reduce P. aeruginosa induced inflammation in cystic fibrosis bronchial epithelial cells. J Cyst Fibros. 2021;20(4):682–691. doi:10.1016/j.jcf.2021.04.012
41. Parker BJ, Wearsch PA, Veloo ACM, Rodriguez-Palacios A. The genus alistipes: gut bacteria with emerging implications to inflammation, cancer, and mental health. Front Immunol. 2020;11:906. doi:10.3389/fimmu.2020.00906
 © 2024 The Author(s). This work is published and licensed by Dove Medical Press Limited. The
full terms of this license are available at https://www.dovepress.com/terms.php
and incorporate the Creative Commons Attribution
- Non Commercial (unported, v3.0) License.
By accessing the work you hereby accept the Terms. Non-commercial uses of the work are permitted
without any further permission from Dove Medical Press Limited, provided the work is properly
attributed. For permission for commercial use of this work, please see paragraphs 4.2 and 5 of our Terms.
© 2024 The Author(s). This work is published and licensed by Dove Medical Press Limited. The
full terms of this license are available at https://www.dovepress.com/terms.php
and incorporate the Creative Commons Attribution
- Non Commercial (unported, v3.0) License.
By accessing the work you hereby accept the Terms. Non-commercial uses of the work are permitted
without any further permission from Dove Medical Press Limited, provided the work is properly
attributed. For permission for commercial use of this work, please see paragraphs 4.2 and 5 of our Terms.